29
/
en
AIzaSyAYiBZKx7MnpbEhh9jyipgxe19OcubqV5w
April 1, 2024
216930
Pakistan
PAK
true
2
1
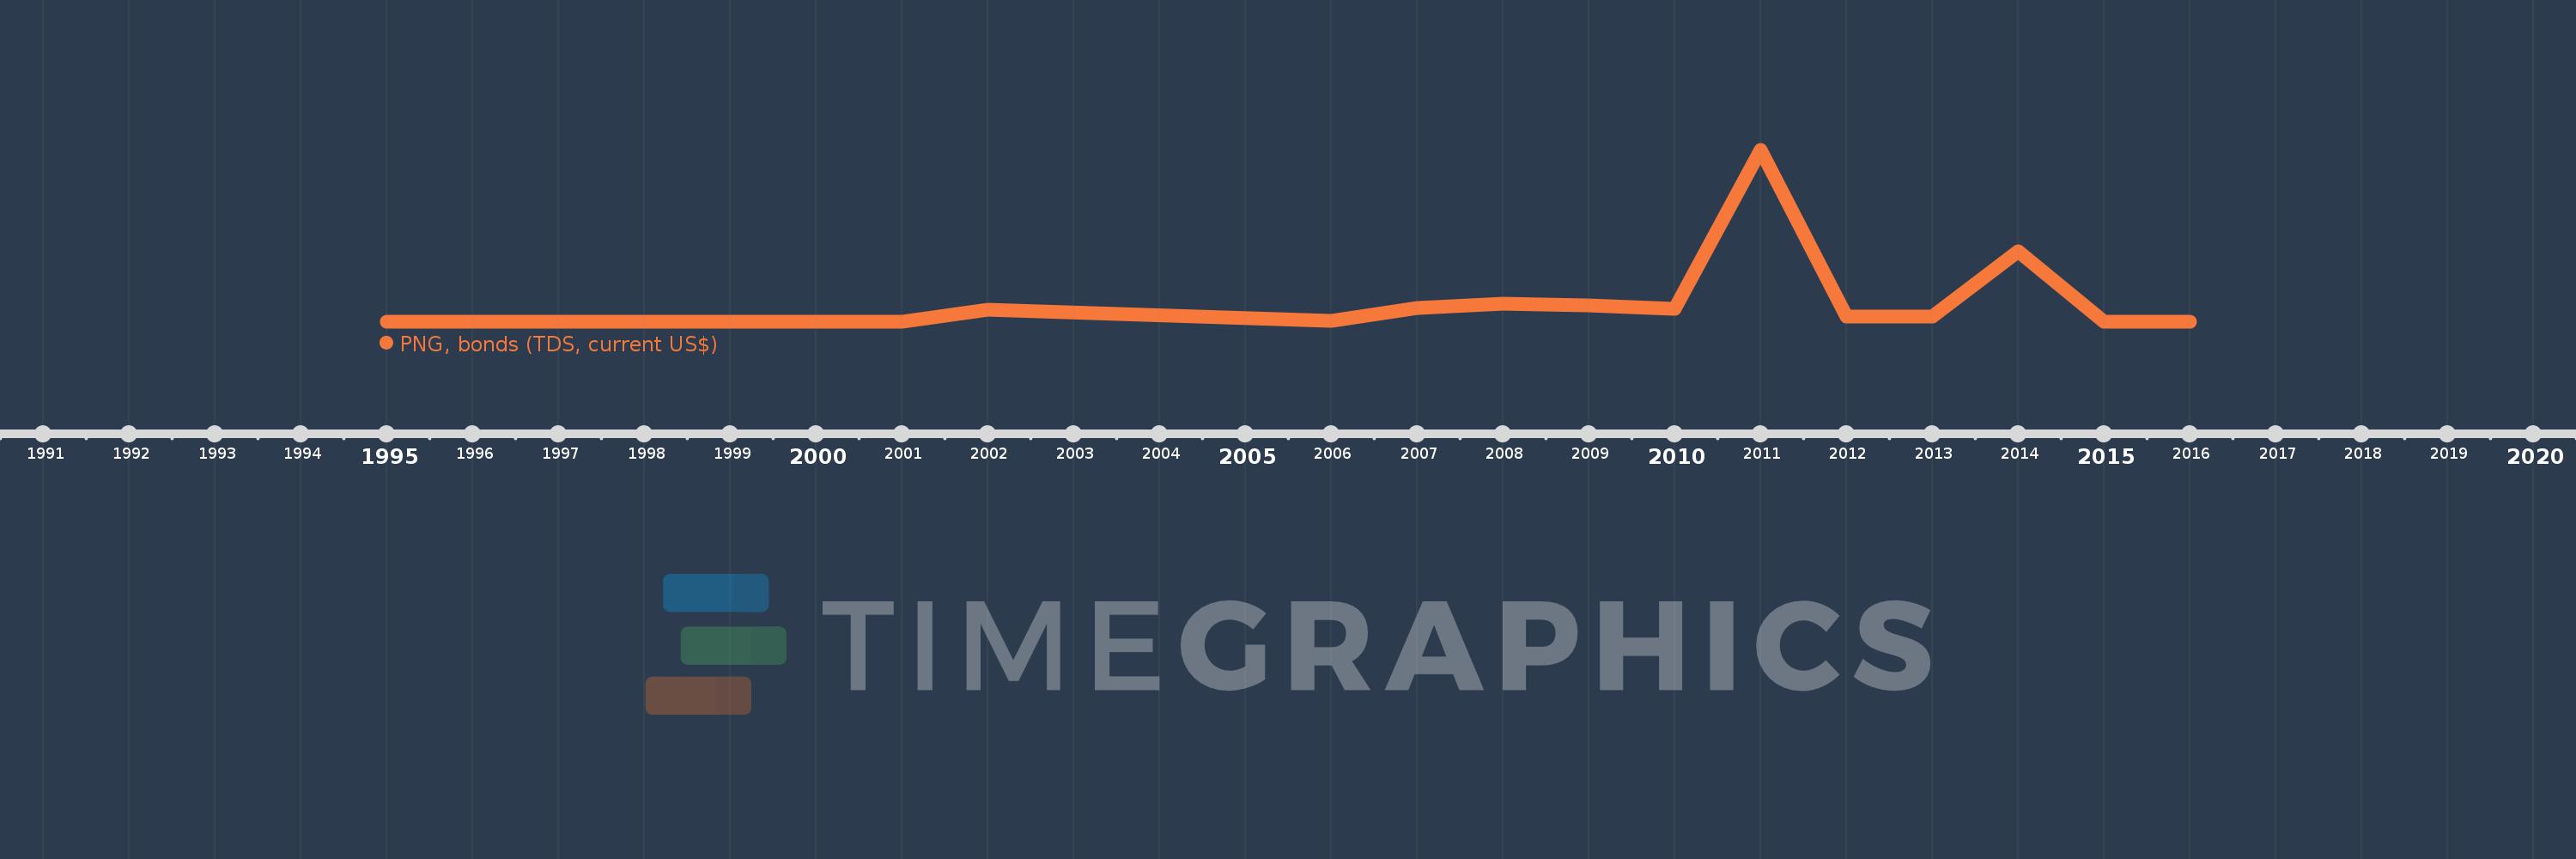
PNG, bonds (TDS, current US$)
2016,2015,2014,2013,2012,2011,2010,2009,2008,2007,2006,2002,2001,2000,1999,1998,1997,1996,1995
This statistics in other country:
Timeline:
This timeline shows a graph from 1995 to 2016 of Pakistan. No data until 1994. Number of actual observations by date: 19.
Source name:
World Development Indicators
Source organization:
World Bank, International Debt Statistics.
Categories, topics:
External Debt
Last updated:
apr 23, 2017
Indicators value changes by year
Minimum:
160.0K
jan 1, 2015
Maximum:
630.427 mln
jan 1, 2011
At the date of observation
Value
Absolute change
Change from previous value
jan 1, 1995
675.0K
+675.0K
0.0%
jan 1, 1996
2.25 mln
+1.575 mln
233.33%
jan 1, 1997
2.25 mln
0.0
0.0%
jan 1, 1998
2.25 mln
0.0
0.0%
jan 1, 1999
2.25 mln
0.0
0.0%
jan 1, 2000
2.25 mln
0.0
0.0%
jan 1, 2001
2.25 mln
0.0
0.0%
jan 1, 2002
46.125 mln
+43.875 mln
1.95K%
jan 1, 2006
2.955 mln
-43.17 mln
-93.59%
jan 1, 2007
52.27 mln
+49.315 mln
1.67K%
jan 1, 2008
67.046 mln
+14.776 mln
28.27%
jan 1, 2009
60.161 mln
-6.885 mln
-10.27%
jan 1, 2010
49.523 mln
-10.638 mln
-17.68%
jan 1, 2011
630.427 mln
+580.904 mln
1.17K%
jan 1, 2012
21.562 mln
-608.865 mln
-96.58%
jan 1, 2013
21.562 mln
0.0
0.0%
jan 1, 2014
260.781 mln
+239.219 mln
1.11K%
jan 1, 2015
160.0K
-260.621 mln
-99.94%
jan 1, 2016
180.0K
+20.0K
12.5%
Ranking of countries by current statistics by years


Comments: