29
/
en
AIzaSyAYiBZKx7MnpbEhh9jyipgxe19OcubqV5w
April 1, 2024
166641
Kazakhstan
KAZ
true
2
1
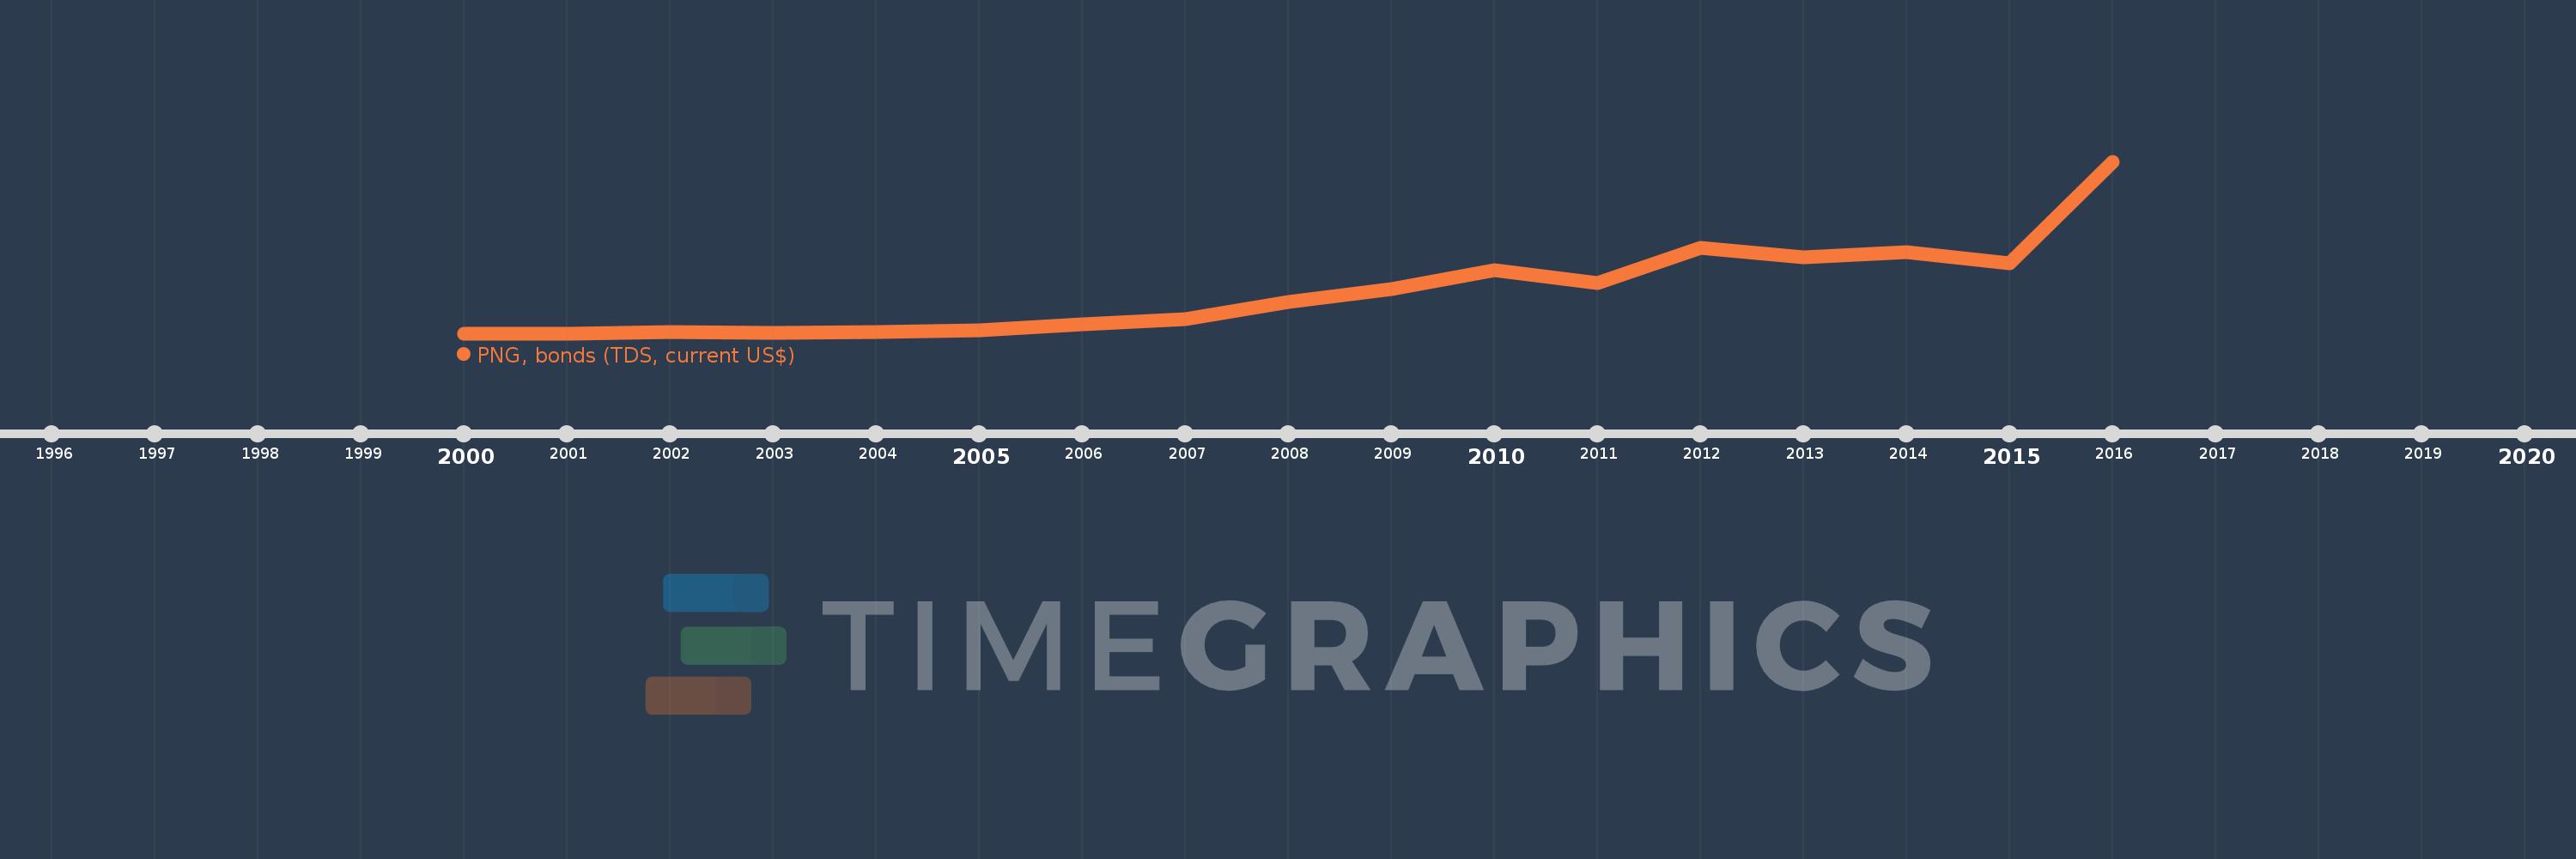
PNG, bonds (TDS, current US$)
2016,2015,2014,2013,2012,2011,2010,2009,2008,2007,2006,2005,2004,2003,2002,2001,2000
This statistics in other country:
Timeline:
This timeline shows a graph from 2000 to 2016 of Kazakhstan. No data until 1999. Number of actual observations by date: 17.
Source name:
World Development Indicators
Source organization:
World Bank, International Debt Statistics.
Categories, topics:
External Debt
Last updated:
apr 23, 2017
Indicators value changes by year
Minimum:
11.25 mln
jan 1, 2000
Maximum:
10.288 bln
jan 1, 2016
At the date of observation
Value
Absolute change
Change from previous value
jan 1, 2000
11.25 mln
+11.25 mln
0.0%
jan 1, 2001
11.25 mln
0.0
0.0%
jan 1, 2002
111.375 mln
+100.125 mln
890.0%
jan 1, 2003
26.625 mln
-84.75 mln
-76.09%
jan 1, 2004
99.429 mln
+72.804 mln
273.44%
jan 1, 2005
196.208 mln
+96.779 mln
97.33%
jan 1, 2006
543.266 mln
+347.058 mln
176.88%
jan 1, 2007
833.675 mln
+290.409 mln
53.46%
jan 1, 2008
1.91 bln
+1.076 bln
129.11%
jan 1, 2009
2.652 bln
+742.037 mln
38.85%
jan 1, 2010
3.813 bln
+1.161 bln
43.79%
jan 1, 2011
3.028 bln
-784.954 mln
-20.58%
jan 1, 2012
5.131 bln
+2.103 bln
69.44%
jan 1, 2013
4.572 bln
-558.876 mln
-10.89%
jan 1, 2014
4.864 bln
+291.771 mln
6.38%
jan 1, 2015
4.207 bln
-657.369 mln
-13.51%
jan 1, 2016
10.288 bln
+6.081 bln
144.54%
Ranking of countries by current statistics by years


Comments: