30
/
AIzaSyAYiBZKx7MnpbEhh9jyipgxe19OcubqV5w
April 1, 2024
163054
Jamaica
JAM
true
2
1
PNG, bonds (TDS, current US$)
2016,2015,2014,2013,2012,2011,2010,2009,2008,2007,2006,2001,2000,1999,1998,1997,1996,1995
Public Timelines
FAQ
Menu
Public Timelines
FAQ
Public Timelines
FAQ
For education
For educational institutions
For teachers
For students
Open cabinet
For educational institutions
For teachers
For students
Open cabinet
Create
Close
Create a timeline
Public timelines
Library
FAQ
Download
Global statistics library
→
Jamaica
→
PNG, bonds (TDS, current US$)
This statistics in other country:
Argentina
Botswana
Brazil
Bulgaria
China
Colombia
Costa Rica
Dominican Republic
East Asia & Pacific (excluding high income)
Ecuador
Egypt, Arab Rep.
El Salvador
Europe & Central Asia (excluding high income)
Georgia
Ghana
Guatemala
IDA only
India
Indonesia
Jamaica
Kazakhstan
Lao PDR
Latin America & Caribbean (excluding high income)
Lebanon
Low & middle income
Lower middle income
Malaysia
Mexico
Middle East & North Africa (excluding high income)
Middle income
Mongolia
Nigeria
Pakistan
Panama
Paraguay
Peru
Philippines
Romania
Russian Federation
Serbia
South Africa
South Asia
Sri Lanka
Sub-Saharan Africa (excluding high income)
Thailand
Turkey
Ukraine
Upper middle income
Venezuela, RB
Vietnam
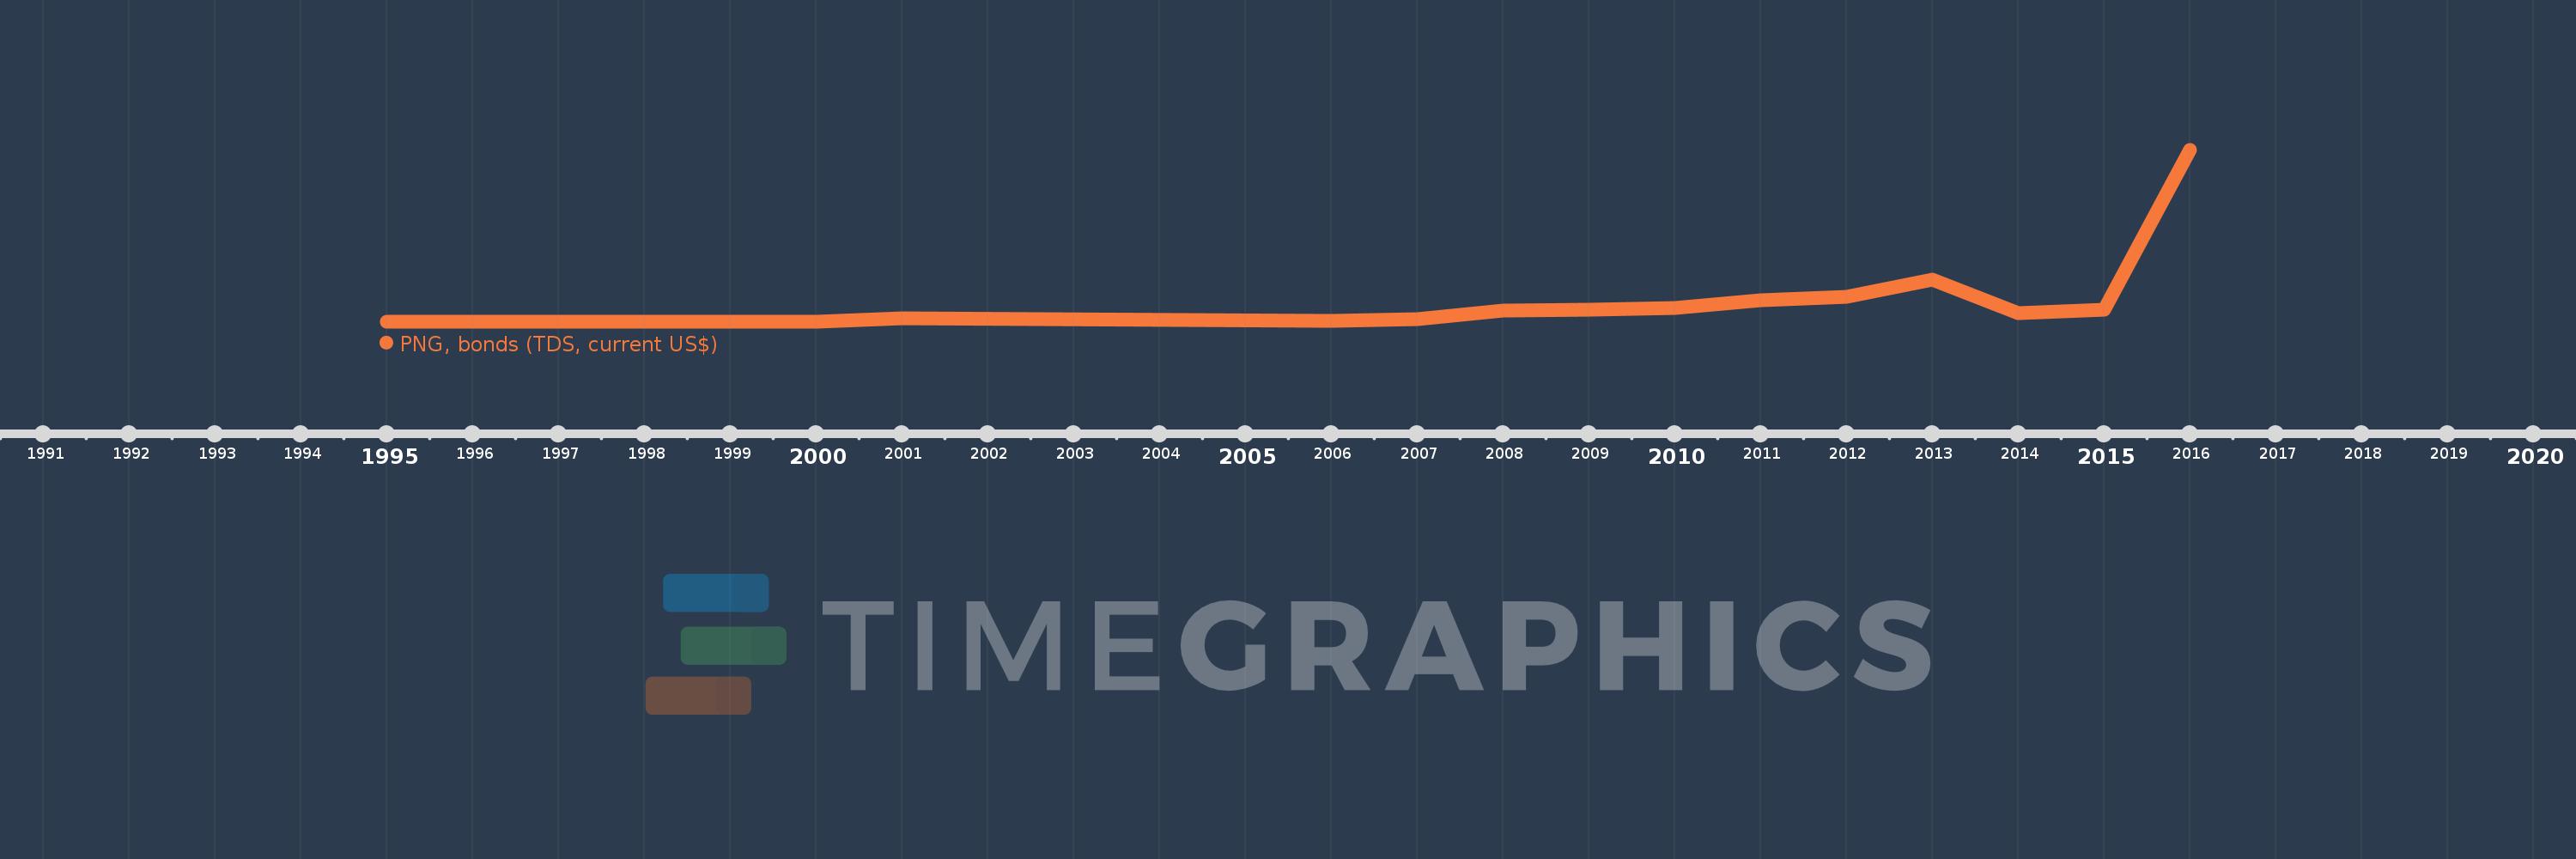
Timeline:
This timeline shows a graph from
1995
to
2016
of Jamaica. No data until
1994
. Number of actual observations by date:
18
.
Source name:
World Development Indicators
Source organization:
World Bank, International Debt Statistics.
Categories, topics:
External Debt
Last updated:
apr 23, 2017
Indicators value changes by year
Meaning:
291.023 mln
Minimum:
696.0K
jan 1, 1995
Maximum:
2.732 bln
jan 1, 2016
At the date of observation
Value
Absolute change
Change from the previous value
jan 1, 1995
696.0K
+696.0K
0.0%
jan 1, 1996
4.64 mln
+3.944 mln
566.67%
jan 1, 1997
4.64 mln
0.0
0.0%
jan 1, 1998
4.64 mln
0.0
0.0%
jan 1, 1999
4.64 mln
0.0
0.0%
jan 1, 2000
4.64 mln
0.0
0.0%
jan 1, 2001
57.32 mln
+52.68 mln
1.14K%
jan 1, 2006
20.812 mln
-36.508 mln
-63.69%
jan 1, 2007
44.95 mln
+24.138 mln
115.98%
jan 1, 2008
180.587 mln
+135.637 mln
301.75%
jan 1, 2009
190.537 mln
+9.95 mln
5.51%
jan 1, 2010
223.866 mln
+33.329 mln
17.49%
jan 1, 2011
340.138 mln
+116.272 mln
51.94%
jan 1, 2012
405.504 mln
+65.366 mln
19.22%
jan 1, 2013
675.839 mln
+270.335 mln
66.67%
jan 1, 2014
141.25 mln
-534.589 mln
-79.1%
jan 1, 2015
201.25 mln
+60.0 mln
42.48%
jan 1, 2016
2.732 bln
+2.531 bln
1.26K%
Ranking of countries by current statistics by years
About & Feedback
Terms
Privacy
Library
2024
©
Time.Graphics
Support 24/7
Cabinet
Get premium
Donate
The service accepts bank transfer (ACH, Wire) or cards (Visa, MasterCard, etc). Processed by Stripe.
Secured with SSL
Excellent (Trustpilot Reviews)
Based on 115+ reviews
Write your own review on
Trustpilot.com
