29
/
en
AIzaSyAYiBZKx7MnpbEhh9jyipgxe19OcubqV5w
April 1, 2024
192834
Mauritania
MRT
true
2
1
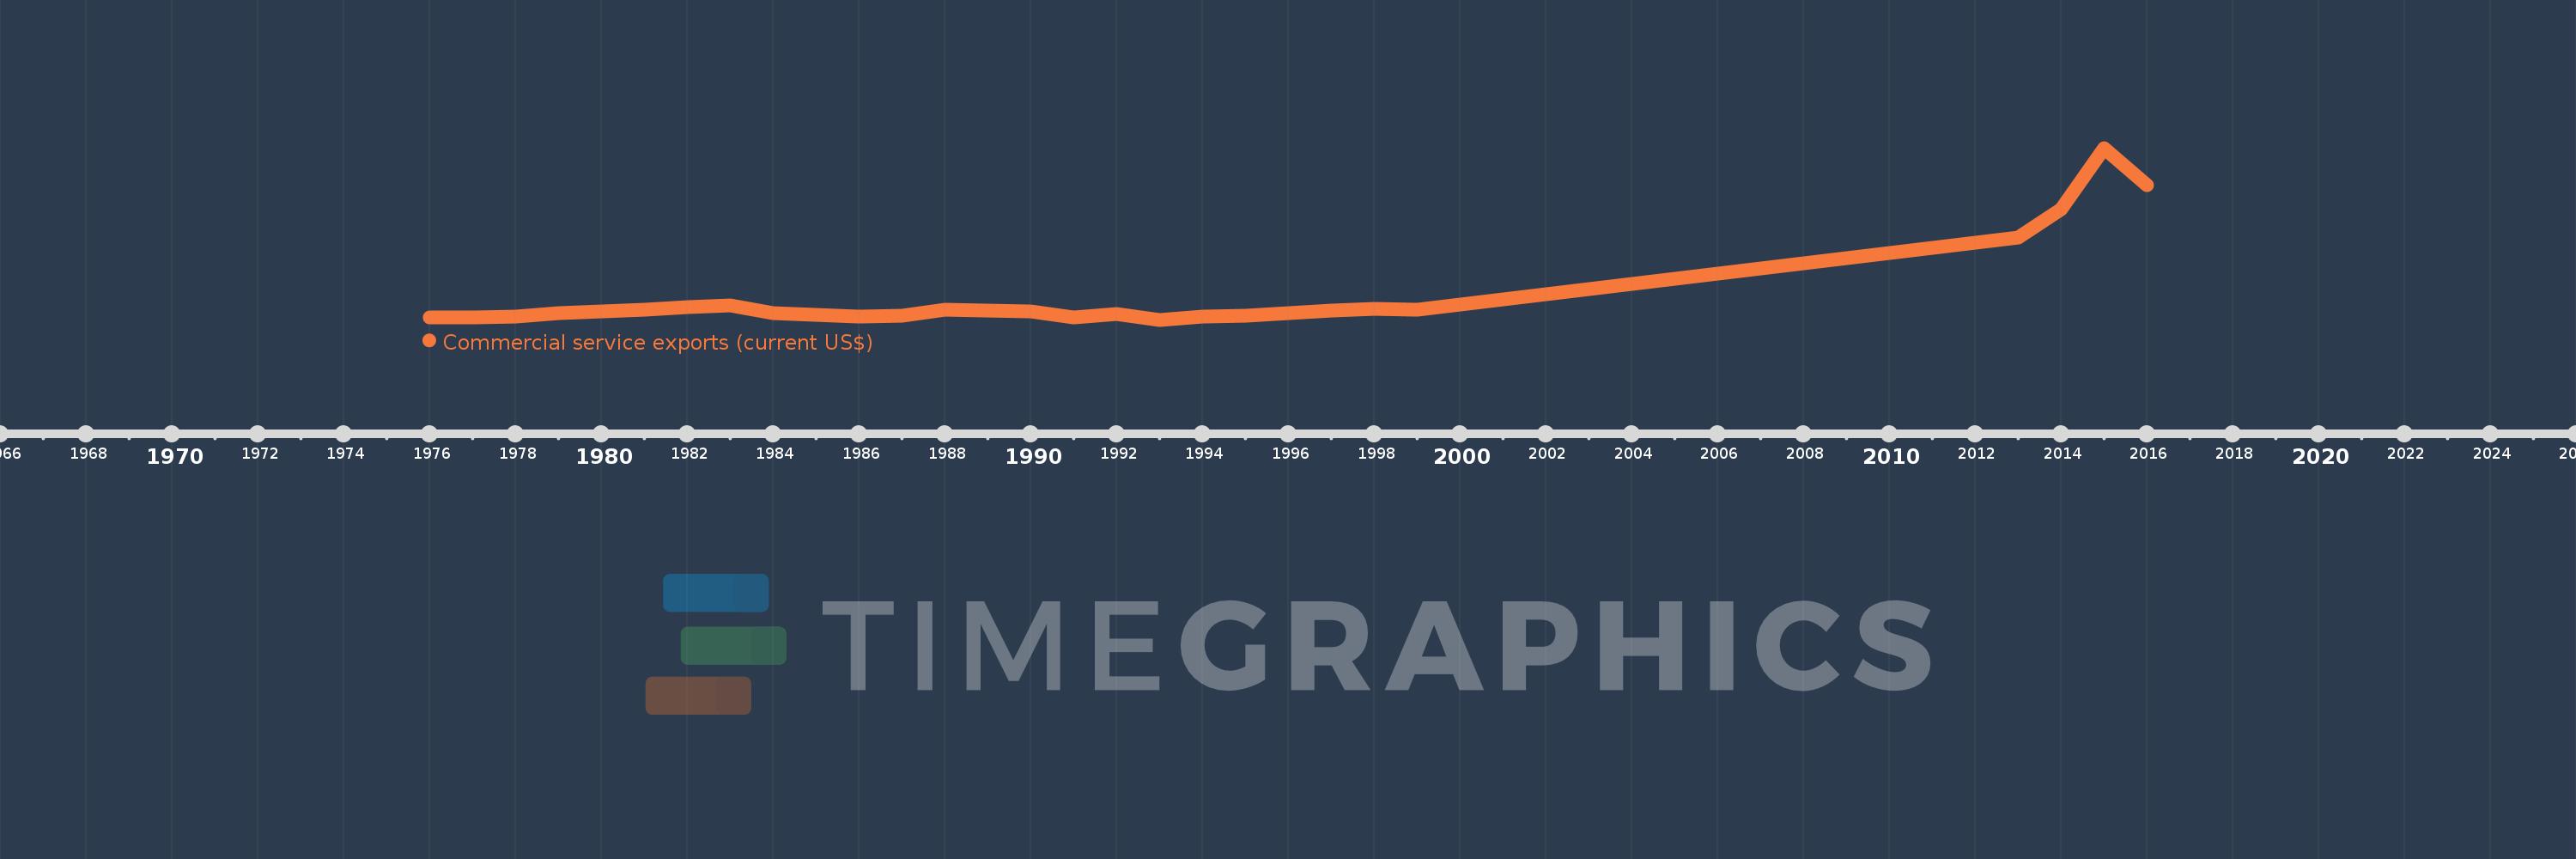
Commercial service exports (current US$)
2016,2015,2014,2013,1999,1998,1997,1996,1995,1994,1993,1992,1991,1990,1989,1988,1987,1986,1985,1984,1983,1982,1981,1980,1979,1978,1977,1976
This statistics in other country:
AfghanistanAlbaniaAlgeriaAngolaAntigua and BarbudaArab WorldArgentinaArmeniaArubaAustraliaAustriaAzerbaijanBahamas, TheBahrainBangladeshBarbadosBelarusBelgiumBelizeBeninBermudaBhutanBoliviaBosnia and HerzegovinaBotswanaBrazilBrunei DarussalamBulgariaBurkina FasoBurundiCabo VerdeCambodiaCameroonCanadaCaribbean small statesCentral African RepublicCentral Europe and the BalticsChadChileChinaColombiaComorosCongo, Dem. Rep.Congo, Rep.Costa RicaCote d'IvoireCroatiaCuracaoCyprusCzech RepublicDenmarkDjiboutiDominicaDominican RepublicEarly-demographic dividendEast Asia & PacificEast Asia & Pacific (excluding high income)East Asia & Pacific (IDA & IBRD countries)EcuadorEgypt, Arab Rep.El SalvadorEquatorial GuineaEritreaEstoniaEthiopiaEuro areaEurope & Central AsiaEurope & Central Asia (excluding high income)Europe & Central Asia (IDA & IBRD countries)European UnionFaroe IslandsFijiFinlandFragile and conflict affected situationsFranceFrench PolynesiaGabonGambia, TheGeorgiaGermanyGhanaGreeceGrenadaGuatemalaGuineaGuinea-BissauGuyanaHaitiHeavily indebted poor countries (HIPC)High incomeHondurasHong Kong SAR, ChinaHungaryIBRD onlyIcelandIDA & IBRD totalIDA blendIDA onlyIDA totalIndiaIndonesiaIran, Islamic Rep.IraqIrelandIsraelItalyJamaicaJapanJordanKazakhstanKenyaKiribatiKorea, Rep.KosovoKuwaitKyrgyz RepublicLao PDRLate-demographic dividendLatin America & Caribbean Latin America & Caribbean (excluding high income)Latin America & the Caribbean (IDA & IBRD countries)LatviaLeast developed countries: UN classificationLebanonLesothoLiberiaLibyaLithuaniaLow & middle incomeLow incomeLower middle incomeLuxembourgMacao SAR, ChinaMacedonia, FYRMadagascarMalawiMalaysiaMaldivesMaliMaltaMarshall IslandsMauritaniaMauritiusMexicoMicronesia, Fed. Sts.Middle East & North Africa (excluding high income)Middle East & North Africa (IDA & IBRD countries)Middle incomeMoldovaMongoliaMontenegroMoroccoMozambiqueMyanmarNamibiaNepalNetherlandsNew CaledoniaNew ZealandNicaraguaNigerNigeriaNorth AmericaNorwayOECD membersOmanPacific island small statesPakistanPalauPanamaPapua New GuineaParaguayPeruPhilippinesPolandPortugalPost-demographic dividendPre-demographic dividendQatarRomaniaRussian FederationRwandaSamoaSao Tome and PrincipeSaudi ArabiaSenegalSerbiaSeychellesSierra LeoneSingaporeSint Maarten (Dutch part)Slovak RepublicSloveniaSolomon IslandsSouth AfricaSouth AsiaSouth Asia (IDA & IBRD)South SudanSpainSri LankaSt. Kitts and NevisSt. LuciaSt. Vincent and the GrenadinesSub-Saharan Africa Sub-Saharan Africa (excluding high income)Sub-Saharan Africa (IDA & IBRD countries)SudanSurinameSwazilandSwedenSwitzerlandSyrian Arab RepublicTajikistanTanzaniaThailandTimor-LesteTogoTongaTrinidad and TobagoTunisiaTurkeyTuvaluUgandaUkraineUnited KingdomUnited StatesUpper middle incomeUruguayVanuatuVenezuela, RBVietnamWest Bank and GazaWorldYemen, Rep.ZambiaZimbabwe Timeline:
This timeline shows a graph from 1976 to 2016 of Mauritania. No data until 1975. Number of actual observations by date: 28.
Source name:
World Development Indicators
Source organization:
International Monetary Fund, Balance of Payments Statistics Yearbook and data files.
Categories, topics:
Private Sector, Trade
Last updated:
apr 23, 2017
Indicators value changes by year
Minimum:
10.399 mln
jan 1, 1993
Maximum:
255.316 mln
jan 1, 2015
At the date of observation
Value
Absolute change
Change from previous value
jan 1, 1976
13.177 mln
+13.177 mln
0.0%
jan 1, 1977
13.838 mln
+660.248K
5.01%
jan 1, 1978
15.289 mln
+1.452 mln
10.49%
jan 1, 1979
20.125 mln
+4.835 mln
31.62%
jan 1, 1980
22.378 mln
+2.254 mln
11.2%
jan 1, 1981
24.981 mln
+2.603 mln
11.63%
jan 1, 1982
28.491 mln
+3.51 mln
14.05%
jan 1, 1983
30.308 mln
+1.817 mln
6.38%
jan 1, 1984
20.233 mln
-10.075 mln
-33.24%
jan 1, 1985
16.974 mln
-3.259 mln
-16.11%
jan 1, 1986
15.412 mln
-1.562 mln
-9.21%
jan 1, 1987
16.108 mln
+696.004K
4.52%
jan 1, 1988
24.567 mln
+8.46 mln
52.52%
jan 1, 1989
22.907 mln
-1.66 mln
-6.76%
jan 1, 1990
22.263 mln
-643.573K
-2.81%
jan 1, 1991
14.031 mln
-8.233 mln
-36.98%
jan 1, 1992
18.537 mln
+4.506 mln
32.11%
jan 1, 1993
10.399 mln
-8.138 mln
-43.9%
jan 1, 1994
15.33 mln
+4.931 mln
47.42%
jan 1, 1995
16.646 mln
+1.315 mln
8.58%
jan 1, 1996
19.311 mln
+2.666 mln
16.01%
jan 1, 1997
23.473 mln
+4.162 mln
21.55%
jan 1, 1998
25.353 mln
+1.88 mln
8.01%
jan 1, 1999
24.422 mln
-931.182K
-3.67%
jan 1, 2013
127.801 mln
+103.379 mln
423.3%
jan 1, 2014
167.531 mln
+39.73 mln
31.09%
jan 1, 2015
255.316 mln
+87.785 mln
52.4%
jan 1, 2016
202.5 mln
-52.816 mln
-20.69%
Ranking of countries by current statistics by years


Comments: