29
/
en
AIzaSyAYiBZKx7MnpbEhh9jyipgxe19OcubqV5w
April 1, 2024
69585
Argentina
ARG
true
2
1
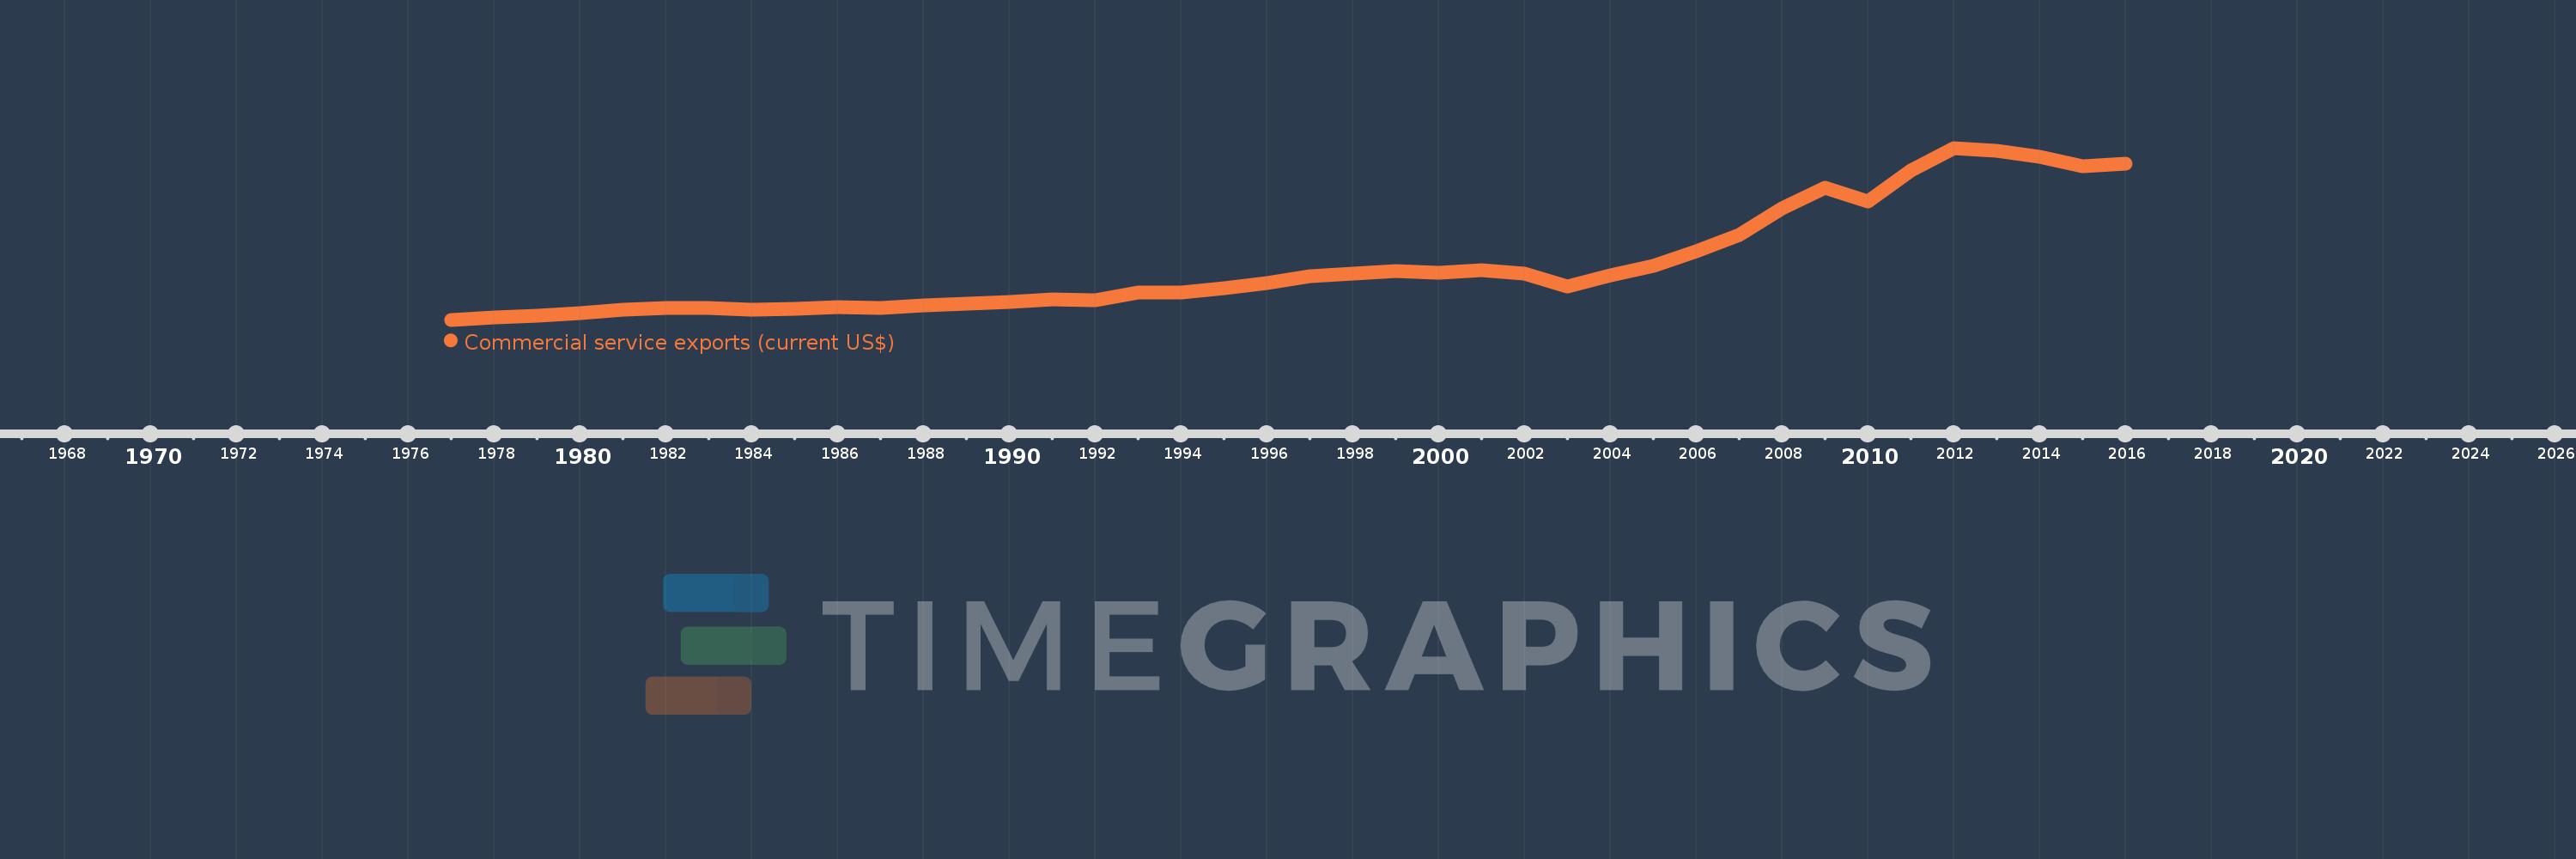
Commercial service exports (current US$)
2016,2015,2014,2013,2012,2011,2010,2009,2008,2007,2006,2005,2004,2003,2002,2001,2000,1999,1998,1997,1996,1995,1994,1993,1992,1991,1990,1989,1988,1987,1986,1985,1984,1983,1982,1981,1980,1979,1978,1977
This statistics in other country:
AfghanistanAlbaniaAlgeriaAngolaAntigua and BarbudaArab WorldArgentinaArmeniaArubaAustraliaAustriaAzerbaijanBahamas, TheBahrainBangladeshBarbadosBelarusBelgiumBelizeBeninBermudaBhutanBoliviaBosnia and HerzegovinaBotswanaBrazilBrunei DarussalamBulgariaBurkina FasoBurundiCabo VerdeCambodiaCameroonCanadaCaribbean small statesCentral African RepublicCentral Europe and the BalticsChadChileChinaColombiaComorosCongo, Dem. Rep.Congo, Rep.Costa RicaCote d'IvoireCroatiaCuracaoCyprusCzech RepublicDenmarkDjiboutiDominicaDominican RepublicEarly-demographic dividendEast Asia & PacificEast Asia & Pacific (excluding high income)East Asia & Pacific (IDA & IBRD countries)EcuadorEgypt, Arab Rep.El SalvadorEquatorial GuineaEritreaEstoniaEthiopiaEuro areaEurope & Central AsiaEurope & Central Asia (excluding high income)Europe & Central Asia (IDA & IBRD countries)European UnionFaroe IslandsFijiFinlandFragile and conflict affected situationsFranceFrench PolynesiaGabonGambia, TheGeorgiaGermanyGhanaGreeceGrenadaGuatemalaGuineaGuinea-BissauGuyanaHaitiHeavily indebted poor countries (HIPC)High incomeHondurasHong Kong SAR, ChinaHungaryIBRD onlyIcelandIDA & IBRD totalIDA blendIDA onlyIDA totalIndiaIndonesiaIran, Islamic Rep.IraqIrelandIsraelItalyJamaicaJapanJordanKazakhstanKenyaKiribatiKorea, Rep.KosovoKuwaitKyrgyz RepublicLao PDRLate-demographic dividendLatin America & Caribbean Latin America & Caribbean (excluding high income)Latin America & the Caribbean (IDA & IBRD countries)LatviaLeast developed countries: UN classificationLebanonLesothoLiberiaLibyaLithuaniaLow & middle incomeLow incomeLower middle incomeLuxembourgMacao SAR, ChinaMacedonia, FYRMadagascarMalawiMalaysiaMaldivesMaliMaltaMarshall IslandsMauritaniaMauritiusMexicoMicronesia, Fed. Sts.Middle East & North Africa (excluding high income)Middle East & North Africa (IDA & IBRD countries)Middle incomeMoldovaMongoliaMontenegroMoroccoMozambiqueMyanmarNamibiaNepalNetherlandsNew CaledoniaNew ZealandNicaraguaNigerNigeriaNorth AmericaNorwayOECD membersOmanPacific island small statesPakistanPalauPanamaPapua New GuineaParaguayPeruPhilippinesPolandPortugalPost-demographic dividendPre-demographic dividendQatarRomaniaRussian FederationRwandaSamoaSao Tome and PrincipeSaudi ArabiaSenegalSerbiaSeychellesSierra LeoneSingaporeSint Maarten (Dutch part)Slovak RepublicSloveniaSolomon IslandsSouth AfricaSouth AsiaSouth Asia (IDA & IBRD)South SudanSpainSri LankaSt. Kitts and NevisSt. LuciaSt. Vincent and the GrenadinesSub-Saharan Africa Sub-Saharan Africa (excluding high income)Sub-Saharan Africa (IDA & IBRD countries)SudanSurinameSwazilandSwedenSwitzerlandSyrian Arab RepublicTajikistanTanzaniaThailandTimor-LesteTogoTongaTrinidad and TobagoTunisiaTurkeyTuvaluUgandaUkraineUnited KingdomUnited StatesUpper middle incomeUruguayVanuatuVenezuela, RBVietnamWest Bank and GazaWorldYemen, Rep.ZambiaZimbabwe Timeline:
This timeline shows a graph from 1977 to 2016 of Argentina. No data until 1976. Number of actual observations by date: 40.
Source name:
World Development Indicators
Source organization:
International Monetary Fund, Balance of Payments Statistics Yearbook and data files.
Categories, topics:
Private Sector, Trade
Last updated:
apr 23, 2017
Indicators value changes by year
Minimum:
547.0 mln
jan 1, 1977
Maximum:
15.088 bln
jan 1, 2012
At the date of observation
Value
Absolute change
Change from previous value
jan 1, 1977
547.0 mln
+547.0 mln
0.0%
jan 1, 1978
775.0 mln
+228.0 mln
41.68%
jan 1, 1979
903.0 mln
+128.0 mln
16.52%
jan 1, 1980
1.076 bln
+173.0 mln
19.16%
jan 1, 1981
1.427 bln
+351.0 mln
32.62%
jan 1, 1982
1.576 bln
+149.0 mln
10.44%
jan 1, 1983
1.513 bln
-63.0 mln
-4.0%
jan 1, 1984
1.405 bln
-108.0 mln
-7.14%
jan 1, 1985
1.449 bln
+44.0 mln
3.13%
jan 1, 1986
1.599 bln
+150.0 mln
10.35%
jan 1, 1987
1.529 bln
-70.0 mln
-4.38%
jan 1, 1988
1.731 bln
+202.0 mln
13.21%
jan 1, 1989
1.894 bln
+163.0 mln
9.42%
jan 1, 1990
2.086 bln
+192.0 mln
10.14%
jan 1, 1991
2.264 bln
+178.0 mln
8.53%
jan 1, 1992
2.174 bln
-90.0 mln
-3.98%
jan 1, 1993
2.842 bln
+668.1 mln
30.73%
jan 1, 1994
2.885 bln
+43.36 mln
1.53%
jan 1, 1995
3.181 bln
+295.14 mln
10.23%
jan 1, 1996
3.664 bln
+483.9 mln
15.21%
jan 1, 1997
4.24 bln
+575.055 mln
15.69%
jan 1, 1998
4.431 bln
+191.217 mln
4.51%
jan 1, 1999
4.695 bln
+263.998 mln
5.96%
jan 1, 2000
4.548 bln
-146.651 mln
-3.12%
jan 1, 2001
4.74 bln
+191.402 mln
4.21%
jan 1, 2002
4.431 bln
-308.467 mln
-6.51%
jan 1, 2003
3.353 bln
-1.078 bln
-24.32%
jan 1, 2004
4.305 bln
+951.62 mln
28.38%
jan 1, 2005
5.082 bln
+777.56 mln
18.06%
jan 1, 2006
6.343 bln
+1.26 bln
24.8%
jan 1, 2007
7.713 bln
+1.371 bln
21.61%
jan 1, 2008
10.007 bln
+2.293 bln
29.73%
jan 1, 2009
11.689 bln
+1.682 bln
16.81%
jan 1, 2010
10.542 bln
-1.147 bln
-9.81%
jan 1, 2011
13.173 bln
+2.631 bln
24.96%
jan 1, 2012
15.088 bln
+1.915 bln
14.54%
jan 1, 2013
14.813 bln
-275.061 mln
-1.82%
jan 1, 2014
14.369 bln
-444.573 mln
-3.0%
jan 1, 2015
13.531 bln
-838.0 mln
-5.83%
jan 1, 2016
13.735 bln
+204.493 mln
1.51%
Ranking of countries by current statistics by years


Comments: