29
/
en
AIzaSyAYiBZKx7MnpbEhh9jyipgxe19OcubqV5w
April 1, 2024
135320
Gabon
GAB
true
2
1
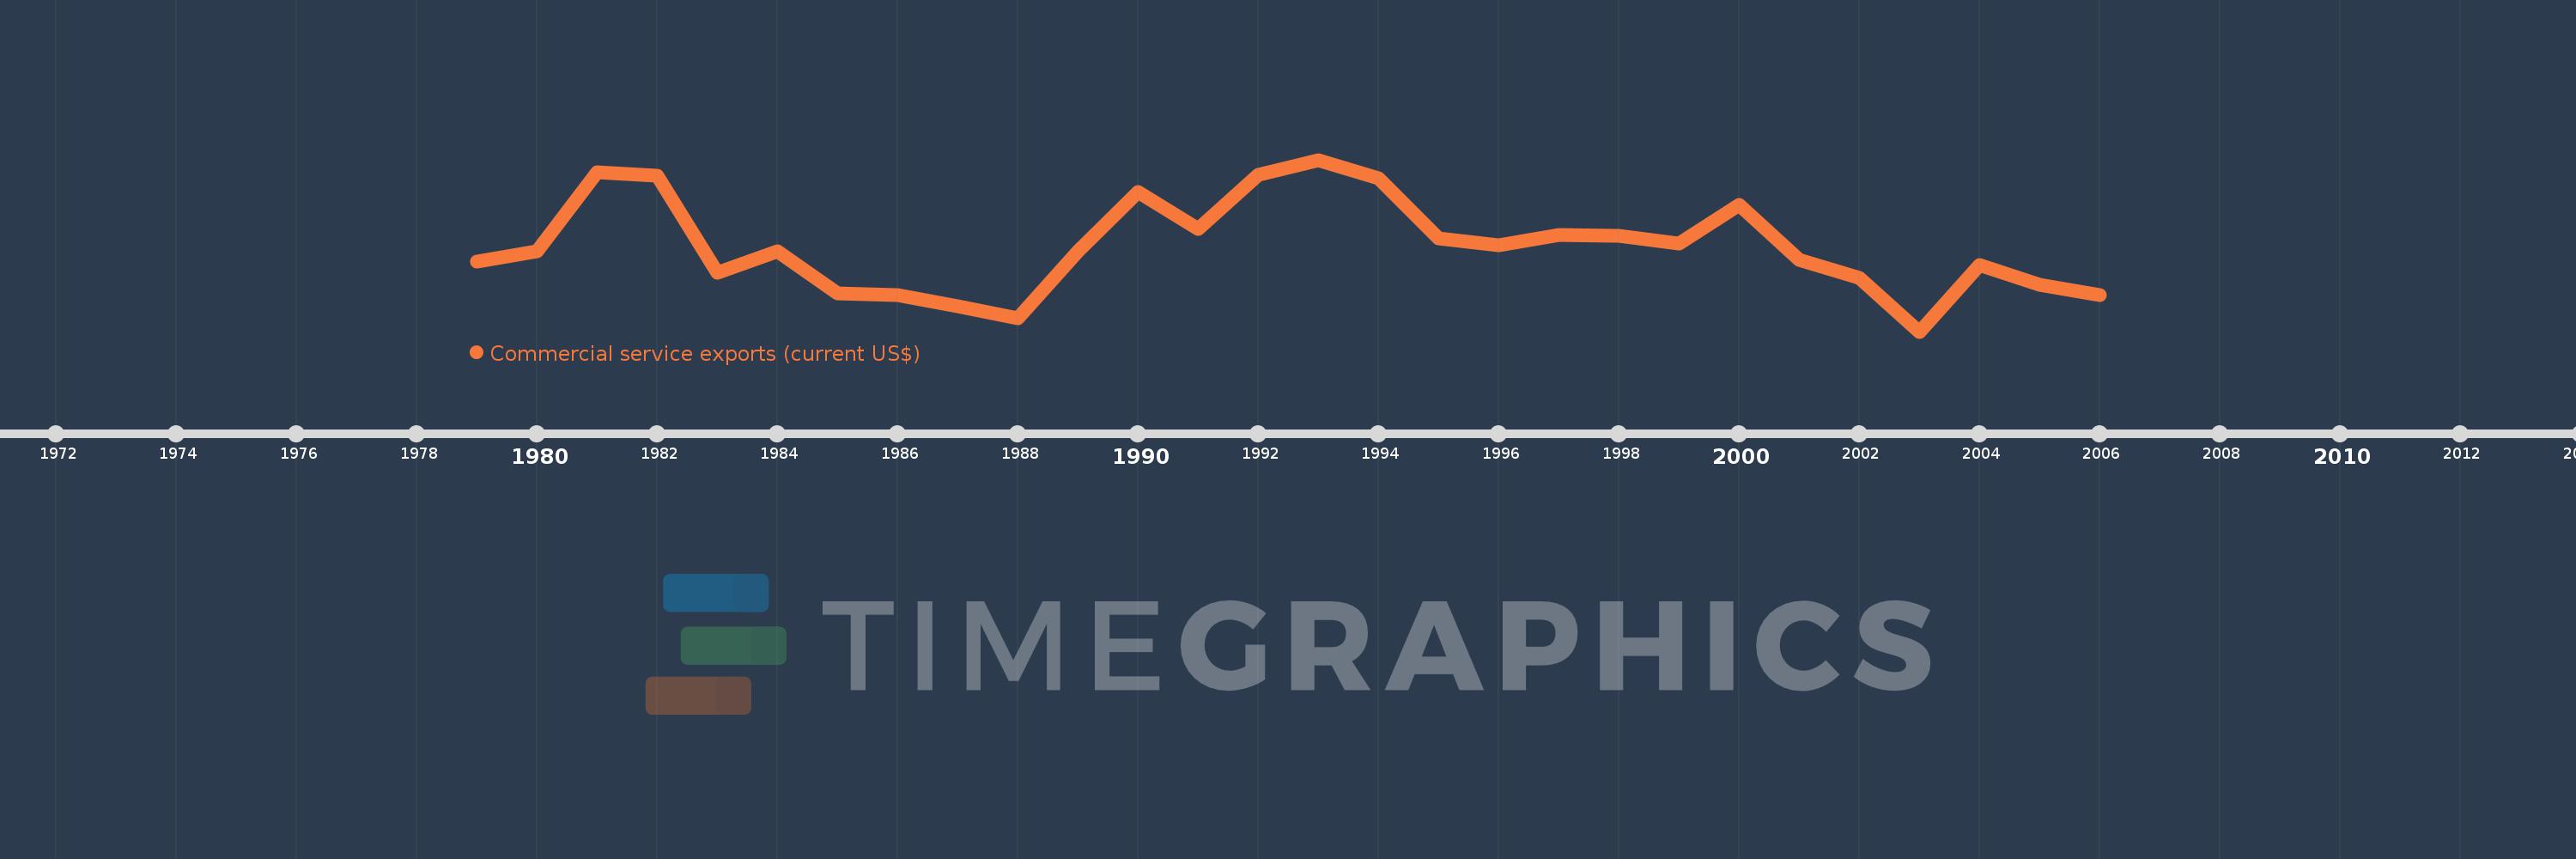
Commercial service exports (current US$)
2006,2005,2004,2003,2002,2001,2000,1999,1998,1997,1996,1995,1994,1993,1992,1991,1990,1989,1988,1987,1986,1985,1984,1983,1982,1981,1980,1979
This statistics in other country:
AfghanistanAlbaniaAlgeriaAngolaAntigua and BarbudaArab WorldArgentinaArmeniaArubaAustraliaAustriaAzerbaijanBahamas, TheBahrainBangladeshBarbadosBelarusBelgiumBelizeBeninBermudaBhutanBoliviaBosnia and HerzegovinaBotswanaBrazilBrunei DarussalamBulgariaBurkina FasoBurundiCabo VerdeCambodiaCameroonCanadaCaribbean small statesCentral African RepublicCentral Europe and the BalticsChadChileChinaColombiaComorosCongo, Dem. Rep.Congo, Rep.Costa RicaCote d'IvoireCroatiaCuracaoCyprusCzech RepublicDenmarkDjiboutiDominicaDominican RepublicEarly-demographic dividendEast Asia & PacificEast Asia & Pacific (excluding high income)East Asia & Pacific (IDA & IBRD countries)EcuadorEgypt, Arab Rep.El SalvadorEquatorial GuineaEritreaEstoniaEthiopiaEuro areaEurope & Central AsiaEurope & Central Asia (excluding high income)Europe & Central Asia (IDA & IBRD countries)European UnionFaroe IslandsFijiFinlandFragile and conflict affected situationsFranceFrench PolynesiaGabonGambia, TheGeorgiaGermanyGhanaGreeceGrenadaGuatemalaGuineaGuinea-BissauGuyanaHaitiHeavily indebted poor countries (HIPC)High incomeHondurasHong Kong SAR, ChinaHungaryIBRD onlyIcelandIDA & IBRD totalIDA blendIDA onlyIDA totalIndiaIndonesiaIran, Islamic Rep.IraqIrelandIsraelItalyJamaicaJapanJordanKazakhstanKenyaKiribatiKorea, Rep.KosovoKuwaitKyrgyz RepublicLao PDRLate-demographic dividendLatin America & Caribbean Latin America & Caribbean (excluding high income)Latin America & the Caribbean (IDA & IBRD countries)LatviaLeast developed countries: UN classificationLebanonLesothoLiberiaLibyaLithuaniaLow & middle incomeLow incomeLower middle incomeLuxembourgMacao SAR, ChinaMacedonia, FYRMadagascarMalawiMalaysiaMaldivesMaliMaltaMarshall IslandsMauritaniaMauritiusMexicoMicronesia, Fed. Sts.Middle East & North Africa (excluding high income)Middle East & North Africa (IDA & IBRD countries)Middle incomeMoldovaMongoliaMontenegroMoroccoMozambiqueMyanmarNamibiaNepalNetherlandsNew CaledoniaNew ZealandNicaraguaNigerNigeriaNorth AmericaNorwayOECD membersOmanPacific island small statesPakistanPalauPanamaPapua New GuineaParaguayPeruPhilippinesPolandPortugalPost-demographic dividendPre-demographic dividendQatarRomaniaRussian FederationRwandaSamoaSao Tome and PrincipeSaudi ArabiaSenegalSerbiaSeychellesSierra LeoneSingaporeSint Maarten (Dutch part)Slovak RepublicSloveniaSolomon IslandsSouth AfricaSouth AsiaSouth Asia (IDA & IBRD)South SudanSpainSri LankaSt. Kitts and NevisSt. LuciaSt. Vincent and the GrenadinesSub-Saharan Africa Sub-Saharan Africa (excluding high income)Sub-Saharan Africa (IDA & IBRD countries)SudanSurinameSwazilandSwedenSwitzerlandSyrian Arab RepublicTajikistanTanzaniaThailandTimor-LesteTogoTongaTrinidad and TobagoTunisiaTurkeyTuvaluUgandaUkraineUnited KingdomUnited StatesUpper middle incomeUruguayVanuatuVenezuela, RBVietnamWest Bank and GazaWorldYemen, Rep.ZambiaZimbabwe Timeline:
This timeline shows a graph from 1979 to 2006 of Gabon. No data until 1978. Number of actual observations by date: 28.
Source name:
World Development Indicators
Source organization:
International Monetary Fund, Balance of Payments Statistics Yearbook and data files.
Categories, topics:
Private Sector, Trade
Last updated:
apr 23, 2017
Indicators value changes by year
Minimum:
67.331 mln
jan 1, 2003
Maximum:
312.061 mln
jan 1, 1993
At the date of observation
Value
Absolute change
Change from previous value
jan 1, 1979
166.98 mln
+166.98 mln
0.0%
jan 1, 1980
181.176 mln
+14.196 mln
8.5%
jan 1, 1981
293.923 mln
+112.748 mln
62.23%
jan 1, 1982
289.293 mln
-4.63 mln
-1.58%
jan 1, 1983
151.732 mln
-137.561 mln
-47.55%
jan 1, 1984
181.989 mln
+30.258 mln
19.94%
jan 1, 1985
122.117 mln
-59.872 mln
-32.9%
jan 1, 1986
118.928 mln
-3.189 mln
-2.61%
jan 1, 1987
102.973 mln
-15.956 mln
-13.42%
jan 1, 1988
86.678 mln
-16.294 mln
-15.82%
jan 1, 1989
181.938 mln
+95.26 mln
109.9%
jan 1, 1990
266.012 mln
+84.074 mln
46.21%
jan 1, 1991
214.056 mln
-51.956 mln
-19.53%
jan 1, 1992
291.024 mln
+76.968 mln
35.96%
jan 1, 1993
312.061 mln
+21.037 mln
7.23%
jan 1, 1994
285.702 mln
-26.359 mln
-8.45%
jan 1, 1995
199.566 mln
-86.136 mln
-30.15%
jan 1, 1996
190.531 mln
-9.036 mln
-4.53%
jan 1, 1997
204.566 mln
+14.035 mln
7.37%
jan 1, 1998
203.596 mln
-969.113K
-0.47%
jan 1, 1999
192.655 mln
-10.942 mln
-5.37%
jan 1, 2000
248.262 mln
+55.608 mln
28.86%
jan 1, 2001
169.74 mln
-78.522 mln
-31.63%
jan 1, 2002
143.306 mln
-26.434 mln
-15.57%
jan 1, 2003
67.331 mln
-75.975 mln
-53.02%
jan 1, 2004
161.87 mln
+94.539 mln
140.41%
jan 1, 2005
133.871 mln
-27.999 mln
-17.3%
jan 1, 2006
119.518 mln
-14.353 mln
-10.72%
Ranking of countries by current statistics by years


Comments: