29
/
en
AIzaSyAYiBZKx7MnpbEhh9jyipgxe19OcubqV5w
April 1, 2024
251704
St. Vincent and the Grenadines
VCT
true
2
1
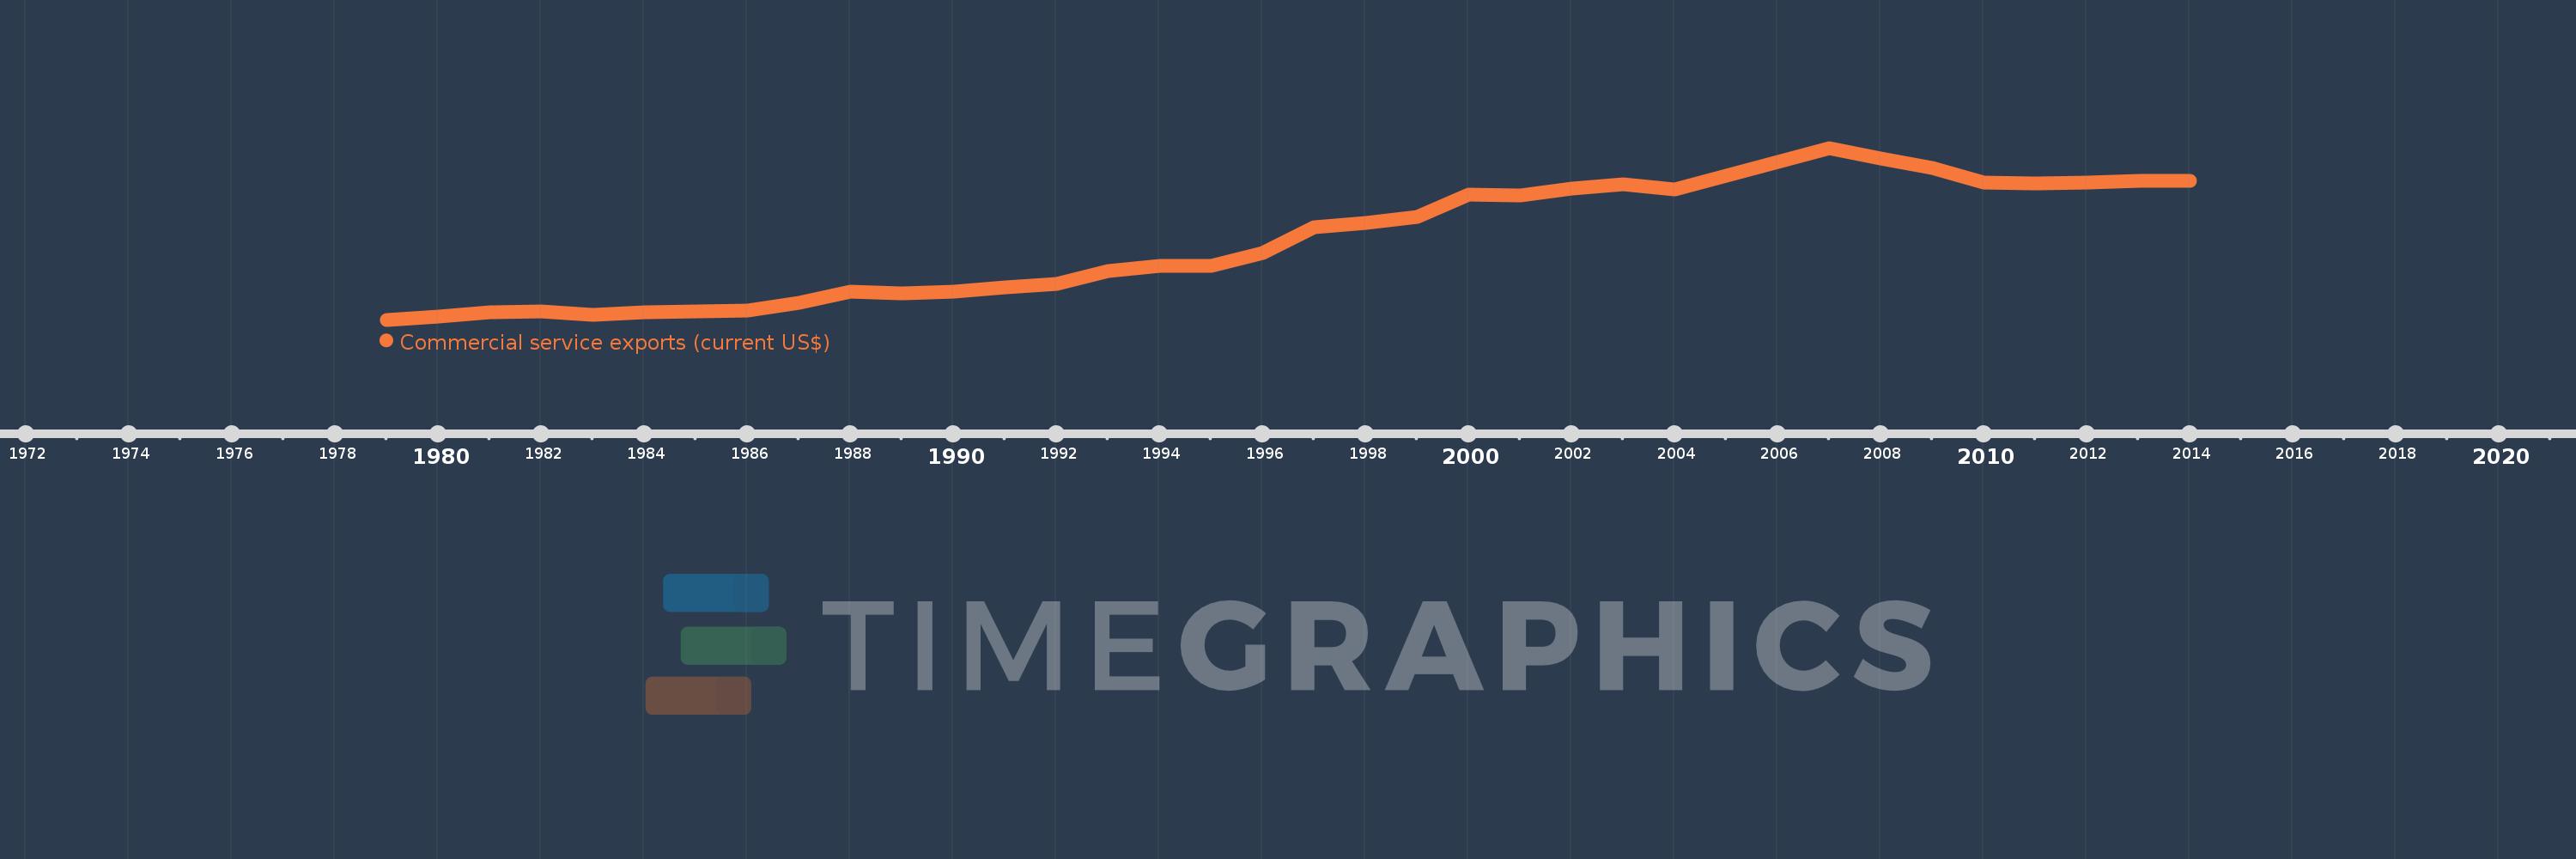
Commercial service exports (current US$)
2014,2013,2012,2011,2010,2009,2008,2007,2006,2005,2004,2003,2002,2001,2000,1999,1998,1997,1996,1995,1994,1993,1992,1991,1990,1989,1988,1987,1986,1985,1984,1983,1982,1981,1980,1979
This statistics in other country:
AfghanistanAlbaniaAlgeriaAngolaAntigua and BarbudaArab WorldArgentinaArmeniaArubaAustraliaAustriaAzerbaijanBahamas, TheBahrainBangladeshBarbadosBelarusBelgiumBelizeBeninBermudaBhutanBoliviaBosnia and HerzegovinaBotswanaBrazilBrunei DarussalamBulgariaBurkina FasoBurundiCabo VerdeCambodiaCameroonCanadaCaribbean small statesCentral African RepublicCentral Europe and the BalticsChadChileChinaColombiaComorosCongo, Dem. Rep.Congo, Rep.Costa RicaCote d'IvoireCroatiaCuracaoCyprusCzech RepublicDenmarkDjiboutiDominicaDominican RepublicEarly-demographic dividendEast Asia & PacificEast Asia & Pacific (excluding high income)East Asia & Pacific (IDA & IBRD countries)EcuadorEgypt, Arab Rep.El SalvadorEquatorial GuineaEritreaEstoniaEthiopiaEuro areaEurope & Central AsiaEurope & Central Asia (excluding high income)Europe & Central Asia (IDA & IBRD countries)European UnionFaroe IslandsFijiFinlandFragile and conflict affected situationsFranceFrench PolynesiaGabonGambia, TheGeorgiaGermanyGhanaGreeceGrenadaGuatemalaGuineaGuinea-BissauGuyanaHaitiHeavily indebted poor countries (HIPC)High incomeHondurasHong Kong SAR, ChinaHungaryIBRD onlyIcelandIDA & IBRD totalIDA blendIDA onlyIDA totalIndiaIndonesiaIran, Islamic Rep.IraqIrelandIsraelItalyJamaicaJapanJordanKazakhstanKenyaKiribatiKorea, Rep.KosovoKuwaitKyrgyz RepublicLao PDRLate-demographic dividendLatin America & Caribbean Latin America & Caribbean (excluding high income)Latin America & the Caribbean (IDA & IBRD countries)LatviaLeast developed countries: UN classificationLebanonLesothoLiberiaLibyaLithuaniaLow & middle incomeLow incomeLower middle incomeLuxembourgMacao SAR, ChinaMacedonia, FYRMadagascarMalawiMalaysiaMaldivesMaliMaltaMarshall IslandsMauritaniaMauritiusMexicoMicronesia, Fed. Sts.Middle East & North Africa (excluding high income)Middle East & North Africa (IDA & IBRD countries)Middle incomeMoldovaMongoliaMontenegroMoroccoMozambiqueMyanmarNamibiaNepalNetherlandsNew CaledoniaNew ZealandNicaraguaNigerNigeriaNorth AmericaNorwayOECD membersOmanPacific island small statesPakistanPalauPanamaPapua New GuineaParaguayPeruPhilippinesPolandPortugalPost-demographic dividendPre-demographic dividendQatarRomaniaRussian FederationRwandaSamoaSao Tome and PrincipeSaudi ArabiaSenegalSerbiaSeychellesSierra LeoneSingaporeSint Maarten (Dutch part)Slovak RepublicSloveniaSolomon IslandsSouth AfricaSouth AsiaSouth Asia (IDA & IBRD)South SudanSpainSri LankaSt. Kitts and NevisSt. LuciaSt. Vincent and the GrenadinesSub-Saharan Africa Sub-Saharan Africa (excluding high income)Sub-Saharan Africa (IDA & IBRD countries)SudanSurinameSwazilandSwedenSwitzerlandSyrian Arab RepublicTajikistanTanzaniaThailandTimor-LesteTogoTongaTrinidad and TobagoTunisiaTurkeyTuvaluUgandaUkraineUnited KingdomUnited StatesUpper middle incomeUruguayVanuatuVenezuela, RBVietnamWest Bank and GazaWorldYemen, Rep.ZambiaZimbabwe Timeline:
This timeline shows a graph from 1979 to 2014 of St. Vincent and the Grenadines. No data until 1978. Number of actual observations by date: 36.
Source name:
World Development Indicators
Source organization:
International Monetary Fund, Balance of Payments Statistics Yearbook and data files.
Categories, topics:
Private Sector, Trade
Last updated:
apr 23, 2017
Indicators value changes by year
Minimum:
11.1 mln
jan 1, 1979
Maximum:
168.843 mln
jan 1, 2007
At the date of observation
Value
Absolute change
Change from previous value
jan 1, 1979
11.1 mln
+11.1 mln
0.0%
jan 1, 1980
13.7 mln
+2.6 mln
23.42%
jan 1, 1981
17.7 mln
+4.0 mln
29.2%
jan 1, 1982
18.9 mln
+1.2 mln
6.78%
jan 1, 1983
15.7 mln
-3.2 mln
-16.93%
jan 1, 1984
17.8 mln
+2.1 mln
13.38%
jan 1, 1985
19.1 mln
+1.3 mln
7.3%
jan 1, 1986
19.2 mln
+100.0K
0.52%
jan 1, 1987
26.667 mln
+7.467 mln
38.89%
jan 1, 1988
36.615 mln
+9.948 mln
37.31%
jan 1, 1989
35.356 mln
-1.259 mln
-3.44%
jan 1, 1990
36.622 mln
+1.267 mln
3.58%
jan 1, 1991
41.093 mln
+4.47 mln
12.21%
jan 1, 1992
43.796 mln
+2.704 mln
6.58%
jan 1, 1993
55.911 mln
+12.115 mln
27.66%
jan 1, 1994
60.637 mln
+4.726 mln
8.45%
jan 1, 1995
60.796 mln
+159.259K
0.26%
jan 1, 1996
72.052 mln
+11.256 mln
18.51%
jan 1, 1997
95.863 mln
+23.811 mln
33.05%
jan 1, 1998
99.885 mln
+4.022 mln
4.2%
jan 1, 1999
105.848 mln
+5.963 mln
5.97%
jan 1, 2000
125.681 mln
+19.833 mln
18.74%
jan 1, 2001
125.522 mln
-159.259K
-0.13%
jan 1, 2002
131.313 mln
+5.79 mln
4.61%
jan 1, 2003
135.243 mln
+3.931 mln
2.99%
jan 1, 2004
131.114 mln
-4.13 mln
-3.05%
jan 1, 2005
143.321 mln
+12.207 mln
9.31%
jan 1, 2006
155.95 mln
+12.629 mln
8.81%
jan 1, 2007
168.843 mln
+12.893 mln
8.27%
jan 1, 2008
158.758 mln
-10.084 mln
-5.97%
jan 1, 2009
150.828 mln
-7.93 mln
-5.0%
jan 1, 2010
136.971 mln
-13.857 mln
-9.19%
jan 1, 2011
136.187 mln
-783.453K
-0.57%
jan 1, 2012
137.363 mln
+1.175 mln
0.86%
jan 1, 2013
138.294 mln
+931.06K
0.68%
jan 1, 2014
138.369 mln
+75.626K
0.05%
Ranking of countries by current statistics by years


Comments: