29
/
en
AIzaSyAYiBZKx7MnpbEhh9jyipgxe19OcubqV5w
April 1, 2024
182886
Macao SAR, China
MAC
true
2
1
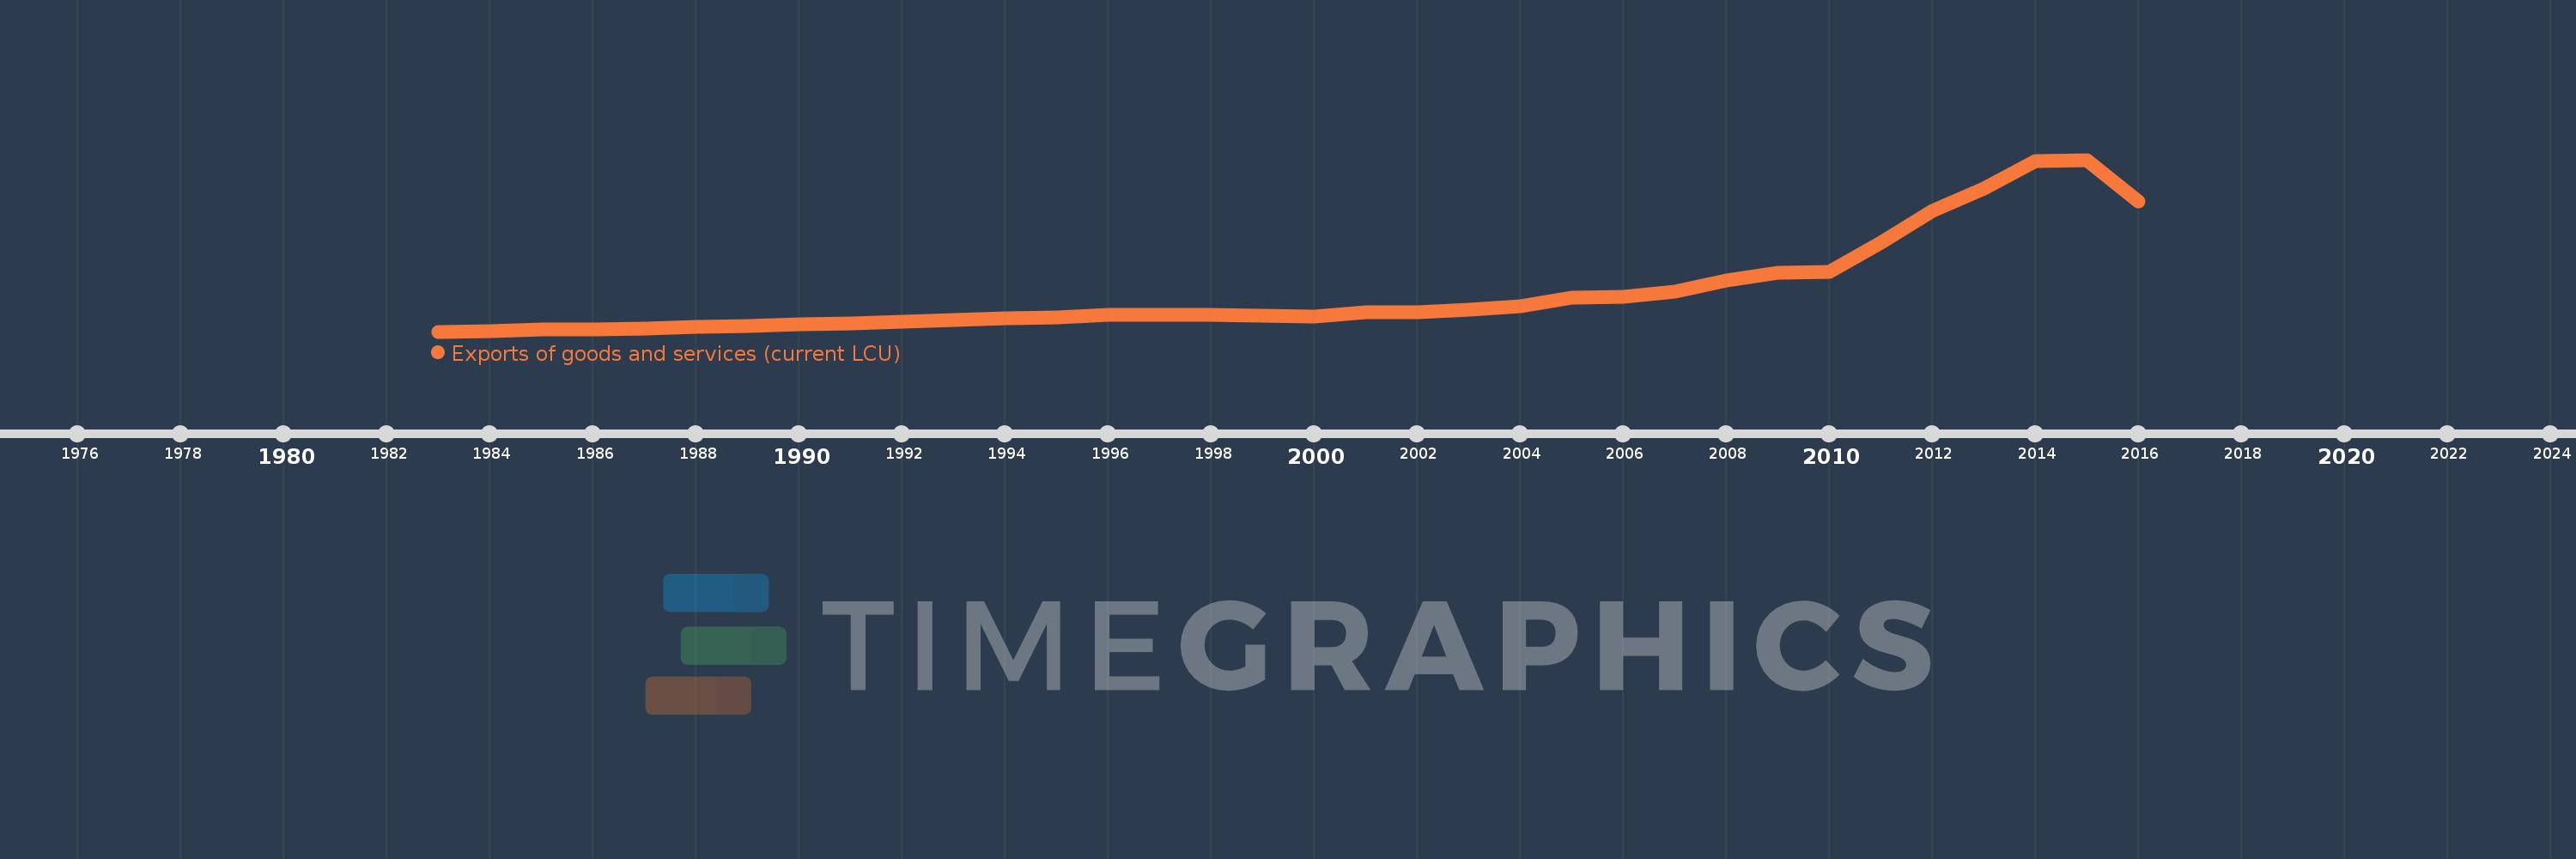
Exports of goods and services (current LCU)
2016,2015,2014,2013,2012,2011,2010,2009,2008,2007,2006,2005,2004,2003,2002,2001,2000,1999,1998,1997,1996,1995,1994,1993,1992,1991,1990,1989,1988,1987,1986,1985,1984,1983
This statistics in other country:
AfghanistanAlbaniaAlgeriaAngolaAntigua and BarbudaArgentinaArmeniaArubaAustraliaAustriaAzerbaijanBahamas, TheBahrainBangladeshBarbadosBelarusBelgiumBelizeBeninBermudaBhutanBoliviaBosnia and HerzegovinaBotswanaBrazilBrunei DarussalamBulgariaBurkina FasoBurundiCabo VerdeCambodiaCameroonCanadaCentral African RepublicChadChileChinaColombiaComorosCongo, Dem. Rep.Congo, Rep.Costa RicaCote d'IvoireCroatiaCubaCyprusCzech RepublicDenmarkDjiboutiDominicaDominican RepublicEcuadorEgypt, Arab Rep.El SalvadorEquatorial GuineaEritreaEstoniaEthiopiaFaroe IslandsFijiFinlandFranceFrench PolynesiaGabonGambia, TheGeorgiaGermanyGhanaGreeceGrenadaGuatemalaGuineaGuinea-BissauGuyanaHaitiHondurasHong Kong SAR, ChinaHungaryIcelandIndiaIndonesiaIran, Islamic Rep.IraqIrelandIsraelItalyJamaicaJapanJordanKazakhstanKenyaKiribatiKorea, Rep.KosovoKuwaitKyrgyz RepublicLao PDRLatviaLebanonLesothoLiberiaLibyaLithuaniaLuxembourgMacao SAR, ChinaMacedonia, FYRMadagascarMalawiMalaysiaMaldivesMaliMaltaMauritaniaMauritiusMexicoMicronesia, Fed. Sts.MoldovaMongoliaMontenegroMoroccoMozambiqueMyanmarNamibiaNepalNetherlandsNew CaledoniaNew ZealandNicaraguaNigerNigeriaNorwayOmanPakistanPalauPanamaPapua New GuineaParaguayPeruPhilippinesPolandPortugalPuerto RicoQatarRomaniaRussian FederationRwandaSamoaSaudi ArabiaSenegalSerbiaSeychellesSierra LeoneSingaporeSlovak RepublicSloveniaSolomon IslandsSomaliaSouth AfricaSouth SudanSpainSri LankaSt. Kitts and NevisSt. LuciaSt. Vincent and the GrenadinesSudanSurinameSwazilandSwedenSwitzerlandSyrian Arab RepublicTajikistanTanzaniaThailandTimor-LesteTogoTongaTrinidad and TobagoTunisiaTurkeyTurkmenistanUgandaUkraineUnited Arab EmiratesUnited KingdomUnited StatesUruguayUzbekistanVanuatuVenezuela, RBVietnamWest Bank and GazaYemen, Rep.ZambiaZimbabwe Timeline:
This timeline shows a graph from 1983 to 2016 of Macao SAR, China. No data until 1982. Number of actual observations by date: 34.
Source name:
World Development Indicators
Source organization:
World Bank national accounts data, and OECD National Accounts data files.
Categories, topics:
Economy & Growth
Last updated:
apr 23, 2017
Indicators value changes by year
Minimum:
8.087 bln
jan 1, 1983
Maximum:
375.477 bln
jan 1, 2015
At the date of observation
Value
Absolute change
Change from previous value
jan 1, 1983
8.087 bln
+8.087 bln
0.0%
jan 1, 1984
9.763 bln
+1.676 bln
20.73%
jan 1, 1985
12.29 bln
+2.526 bln
25.88%
jan 1, 1986
11.821 bln
-468.154 mln
-3.81%
jan 1, 1987
13.62 bln
+1.799 bln
15.21%
jan 1, 1988
17.691 bln
+4.071 bln
29.89%
jan 1, 1989
20.036 bln
+2.345 bln
13.25%
jan 1, 1990
23.306 bln
+3.27 bln
16.32%
jan 1, 1991
26.375 bln
+3.069 bln
13.17%
jan 1, 1992
28.563 bln
+2.188 bln
8.3%
jan 1, 1993
33.358 bln
+4.795 bln
16.79%
jan 1, 1994
35.711 bln
+2.353 bln
7.06%
jan 1, 1995
38.418 bln
+2.707 bln
7.58%
jan 1, 1996
43.233 bln
+4.814 bln
12.53%
jan 1, 1997
44.063 bln
+830.611 mln
1.92%
jan 1, 1998
44.553 bln
+489.484 mln
1.11%
jan 1, 1999
41.757 bln
-2.796 bln
-6.28%
jan 1, 2000
41.119 bln
-637.455 mln
-1.53%
jan 1, 2001
49.179 bln
+8.06 bln
19.6%
jan 1, 2002
50.276 bln
+1.097 bln
2.23%
jan 1, 2003
55.231 bln
+4.955 bln
9.86%
jan 1, 2004
61.425 bln
+6.194 bln
11.21%
jan 1, 2005
80.917 bln
+19.492 bln
31.73%
jan 1, 2006
82.205 bln
+1.288 bln
1.59%
jan 1, 2007
93.48 bln
+11.275 bln
13.72%
jan 1, 2008
116.889 bln
+23.409 bln
25.04%
jan 1, 2009
134.396 bln
+17.507 bln
14.98%
jan 1, 2010
135.322 bln
+926.0 mln
0.69%
jan 1, 2011
197.573 bln
+62.251 bln
46.0%
jan 1, 2012
266.895 bln
+69.322 bln
35.09%
jan 1, 2013
313.215 bln
+46.32 bln
17.36%
jan 1, 2014
373.281 bln
+60.066 bln
19.18%
jan 1, 2015
375.477 bln
+2.196 bln
0.59%
jan 1, 2016
286.824 bln
-88.653 bln
-23.61%
Ranking of countries by current statistics by years


Comments: