29
/
en
AIzaSyAYiBZKx7MnpbEhh9jyipgxe19OcubqV5w
April 1, 2024
220763
Paraguay
PRY
true
2
1
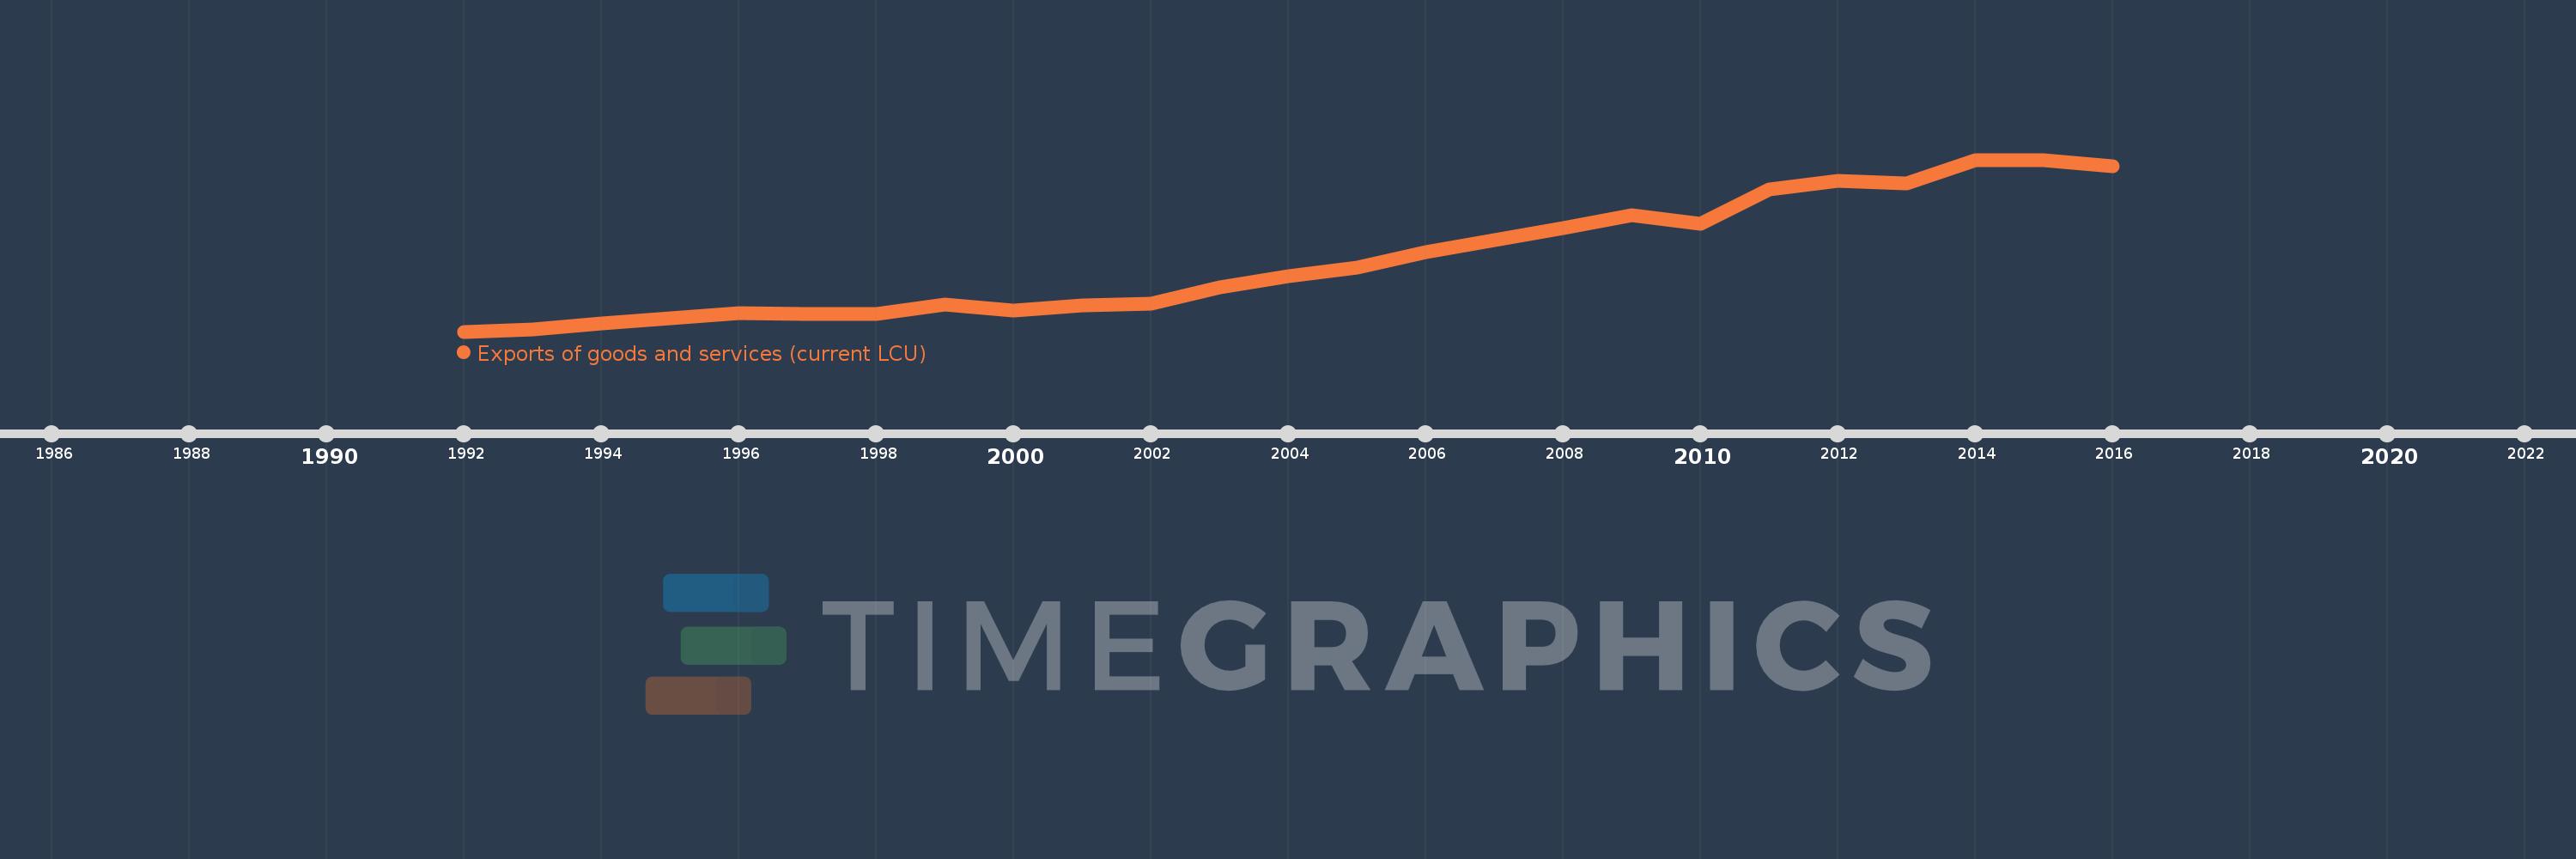
Exports of goods and services (current LCU)
2016,2015,2014,2013,2012,2011,2010,2009,2008,2007,2006,2005,2004,2003,2002,2001,2000,1999,1998,1997,1996,1995,1994,1993,1992
This statistics in other country:
AfghanistanAlbaniaAlgeriaAngolaAntigua and BarbudaArgentinaArmeniaArubaAustraliaAustriaAzerbaijanBahamas, TheBahrainBangladeshBarbadosBelarusBelgiumBelizeBeninBermudaBhutanBoliviaBosnia and HerzegovinaBotswanaBrazilBrunei DarussalamBulgariaBurkina FasoBurundiCabo VerdeCambodiaCameroonCanadaCentral African RepublicChadChileChinaColombiaComorosCongo, Dem. Rep.Congo, Rep.Costa RicaCote d'IvoireCroatiaCubaCyprusCzech RepublicDenmarkDjiboutiDominicaDominican RepublicEcuadorEgypt, Arab Rep.El SalvadorEquatorial GuineaEritreaEstoniaEthiopiaFaroe IslandsFijiFinlandFranceFrench PolynesiaGabonGambia, TheGeorgiaGermanyGhanaGreeceGrenadaGuatemalaGuineaGuinea-BissauGuyanaHaitiHondurasHong Kong SAR, ChinaHungaryIcelandIndiaIndonesiaIran, Islamic Rep.IraqIrelandIsraelItalyJamaicaJapanJordanKazakhstanKenyaKiribatiKorea, Rep.KosovoKuwaitKyrgyz RepublicLao PDRLatviaLebanonLesothoLiberiaLibyaLithuaniaLuxembourgMacao SAR, ChinaMacedonia, FYRMadagascarMalawiMalaysiaMaldivesMaliMaltaMauritaniaMauritiusMexicoMicronesia, Fed. Sts.MoldovaMongoliaMontenegroMoroccoMozambiqueMyanmarNamibiaNepalNetherlandsNew CaledoniaNew ZealandNicaraguaNigerNigeriaNorwayOmanPakistanPalauPanamaPapua New GuineaParaguayPeruPhilippinesPolandPortugalPuerto RicoQatarRomaniaRussian FederationRwandaSamoaSaudi ArabiaSenegalSerbiaSeychellesSierra LeoneSingaporeSlovak RepublicSloveniaSolomon IslandsSomaliaSouth AfricaSouth SudanSpainSri LankaSt. Kitts and NevisSt. LuciaSt. Vincent and the GrenadinesSudanSurinameSwazilandSwedenSwitzerlandSyrian Arab RepublicTajikistanTanzaniaThailandTimor-LesteTogoTongaTrinidad and TobagoTunisiaTurkeyTurkmenistanUgandaUkraineUnited Arab EmiratesUnited KingdomUnited StatesUruguayUzbekistanVanuatuVenezuela, RBVietnamWest Bank and GazaYemen, Rep.ZambiaZimbabwe Timeline:
This timeline shows a graph from 1992 to 2016 of Paraguay. No data until 1991. Number of actual observations by date: 25.
Source name:
World Development Indicators
Source organization:
World Bank national accounts data, and OECD National Accounts data files.
Categories, topics:
Economy & Growth
Last updated:
apr 23, 2017
Indicators value changes by year
Minimum:
4.706 trl
jan 1, 1992
Maximum:
62.269 trl
jan 1, 2015
At the date of observation
Value
Absolute change
Change from previous value
jan 1, 1992
4.706 trl
+4.706 trl
0.0%
jan 1, 1993
5.351 trl
+645.536 bln
13.72%
jan 1, 1994
7.577 trl
+2.226 trl
41.59%
jan 1, 1995
9.118 trl
+1.541 trl
20.34%
jan 1, 1996
10.989 trl
+1.871 trl
20.52%
jan 1, 1997
10.618 trl
-371.078 bln
-3.38%
jan 1, 1998
10.519 trl
-98.846 bln
-0.93%
jan 1, 1999
13.849 trl
+3.329 trl
31.65%
jan 1, 2000
11.852 trl
-1.997 trl
-14.42%
jan 1, 2001
13.384 trl
+1.532 trl
12.93%
jan 1, 2002
14.204 trl
+819.64 bln
6.12%
jan 1, 2003
19.451 trl
+5.248 trl
36.95%
jan 1, 2004
23.295 trl
+3.843 trl
19.76%
jan 1, 2005
26.12 trl
+2.826 trl
12.13%
jan 1, 2006
31.408 trl
+5.287 trl
20.24%
jan 1, 2007
35.235 trl
+3.827 trl
12.19%
jan 1, 2008
39.348 trl
+4.113 trl
11.67%
jan 1, 2009
43.604 trl
+4.257 trl
10.82%
jan 1, 2010
40.777 trl
-2.827 trl
-6.48%
jan 1, 2011
52.307 trl
+11.53 trl
28.28%
jan 1, 2012
55.269 trl
+2.962 trl
5.66%
jan 1, 2013
54.331 trl
-938.444 bln
-1.7%
jan 1, 2014
62.03 trl
+7.7 trl
14.17%
jan 1, 2015
62.269 trl
+239.076 bln
0.39%
jan 1, 2016
60.184 trl
-2.085 trl
-3.35%
Ranking of countries by current statistics by years


Comments: