29
/
en
AIzaSyAYiBZKx7MnpbEhh9jyipgxe19OcubqV5w
April 1, 2024
183795
Macedonia, FYR
MKD
true
2
1
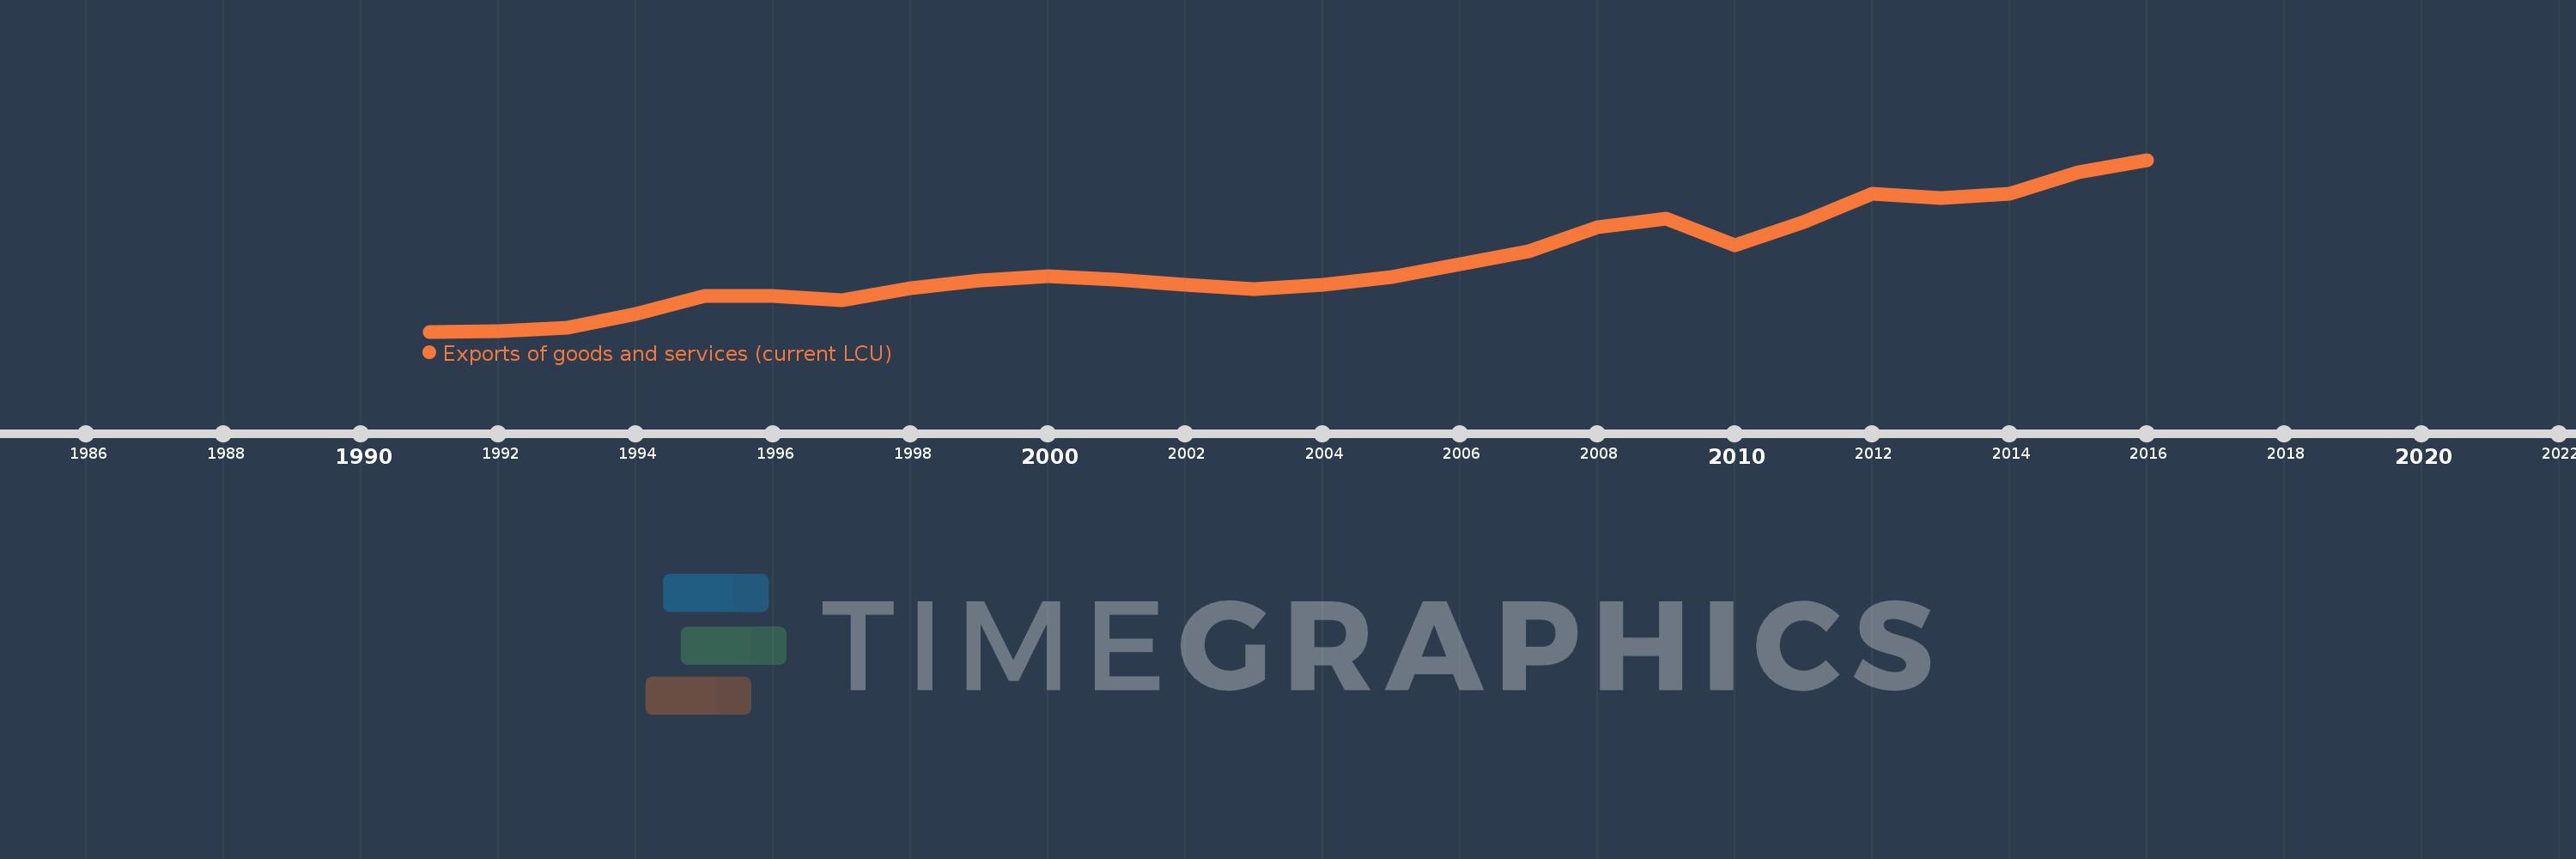
Exports of goods and services (current LCU)
2016,2015,2014,2013,2012,2011,2010,2009,2008,2007,2006,2005,2004,2003,2002,2001,2000,1999,1998,1997,1996,1995,1994,1993,1992,1991
This statistics in other country:
AfghanistanAlbaniaAlgeriaAngolaAntigua and BarbudaArgentinaArmeniaArubaAustraliaAustriaAzerbaijanBahamas, TheBahrainBangladeshBarbadosBelarusBelgiumBelizeBeninBermudaBhutanBoliviaBosnia and HerzegovinaBotswanaBrazilBrunei DarussalamBulgariaBurkina FasoBurundiCabo VerdeCambodiaCameroonCanadaCentral African RepublicChadChileChinaColombiaComorosCongo, Dem. Rep.Congo, Rep.Costa RicaCote d'IvoireCroatiaCubaCyprusCzech RepublicDenmarkDjiboutiDominicaDominican RepublicEcuadorEgypt, Arab Rep.El SalvadorEquatorial GuineaEritreaEstoniaEthiopiaFaroe IslandsFijiFinlandFranceFrench PolynesiaGabonGambia, TheGeorgiaGermanyGhanaGreeceGrenadaGuatemalaGuineaGuinea-BissauGuyanaHaitiHondurasHong Kong SAR, ChinaHungaryIcelandIndiaIndonesiaIran, Islamic Rep.IraqIrelandIsraelItalyJamaicaJapanJordanKazakhstanKenyaKiribatiKorea, Rep.KosovoKuwaitKyrgyz RepublicLao PDRLatviaLebanonLesothoLiberiaLibyaLithuaniaLuxembourgMacao SAR, ChinaMacedonia, FYRMadagascarMalawiMalaysiaMaldivesMaliMaltaMauritaniaMauritiusMexicoMicronesia, Fed. Sts.MoldovaMongoliaMontenegroMoroccoMozambiqueMyanmarNamibiaNepalNetherlandsNew CaledoniaNew ZealandNicaraguaNigerNigeriaNorwayOmanPakistanPalauPanamaPapua New GuineaParaguayPeruPhilippinesPolandPortugalPuerto RicoQatarRomaniaRussian FederationRwandaSamoaSaudi ArabiaSenegalSerbiaSeychellesSierra LeoneSingaporeSlovak RepublicSloveniaSolomon IslandsSomaliaSouth AfricaSouth SudanSpainSri LankaSt. Kitts and NevisSt. LuciaSt. Vincent and the GrenadinesSudanSurinameSwazilandSwedenSwitzerlandSyrian Arab RepublicTajikistanTanzaniaThailandTimor-LesteTogoTongaTrinidad and TobagoTunisiaTurkeyTurkmenistanUgandaUkraineUnited Arab EmiratesUnited KingdomUnited StatesUruguayUzbekistanVanuatuVenezuela, RBVietnamWest Bank and GazaYemen, Rep.ZambiaZimbabwe Timeline:
This timeline shows a graph from 1991 to 2016 of Macedonia, FYR. No data until 1990. Number of actual observations by date: 26.
Source name:
World Development Indicators
Source organization:
World Bank national accounts data, and OECD National Accounts data files.
Categories, topics:
Economy & Growth
Last updated:
apr 23, 2017
Indicators value changes by year
Minimum:
130.701 mln
jan 1, 1991
Maximum:
271.814 bln
jan 1, 2016
At the date of observation
Value
Absolute change
Change from previous value
jan 1, 1991
130.701 mln
+130.701 mln
0.0%
jan 1, 1992
210.789 mln
+80.088 mln
61.28%
jan 1, 1993
6.409 bln
+6.199 bln
2.94K%
jan 1, 1994
27.659 bln
+21.25 bln
331.54%
jan 1, 1995
55.92 bln
+28.261 bln
102.17%
jan 1, 1996
55.961 bln
+41.0 mln
0.07%
jan 1, 1997
49.722 bln
-6.239 bln
-11.15%
jan 1, 1998
69.408 bln
+19.685 bln
39.59%
jan 1, 1999
80.344 bln
+10.936 bln
15.76%
jan 1, 2000
88.143 bln
+7.799 bln
9.71%
jan 1, 2001
81.921 bln
-6.222 bln
-7.06%
jan 1, 2002
73.695 bln
-8.226 bln
-10.04%
jan 1, 2003
68.01 bln
-5.685 bln
-7.71%
jan 1, 2004
74.311 bln
+6.301 bln
9.26%
jan 1, 2005
86.213 bln
+11.902 bln
16.02%
jan 1, 2006
107.363 bln
+21.15 bln
24.53%
jan 1, 2007
126.541 bln
+19.178 bln
17.86%
jan 1, 2008
164.507 bln
+37.966 bln
30.0%
jan 1, 2009
179.334 bln
+14.827 bln
9.01%
jan 1, 2010
136.019 bln
-43.315 bln
-24.15%
jan 1, 2011
173.999 bln
+37.98 bln
27.92%
jan 1, 2012
218.745 bln
+44.746 bln
25.72%
jan 1, 2013
211.764 bln
-6.981 bln
-3.19%
jan 1, 2014
217.803 bln
+6.039 bln
2.85%
jan 1, 2015
251.483 bln
+33.68 bln
15.46%
jan 1, 2016
271.814 bln
+20.331 bln
8.08%
Ranking of countries by current statistics by years


Comments: