29
/
en
AIzaSyAYiBZKx7MnpbEhh9jyipgxe19OcubqV5w
April 1, 2024
199071
Mongolia
MNG
true
2
1
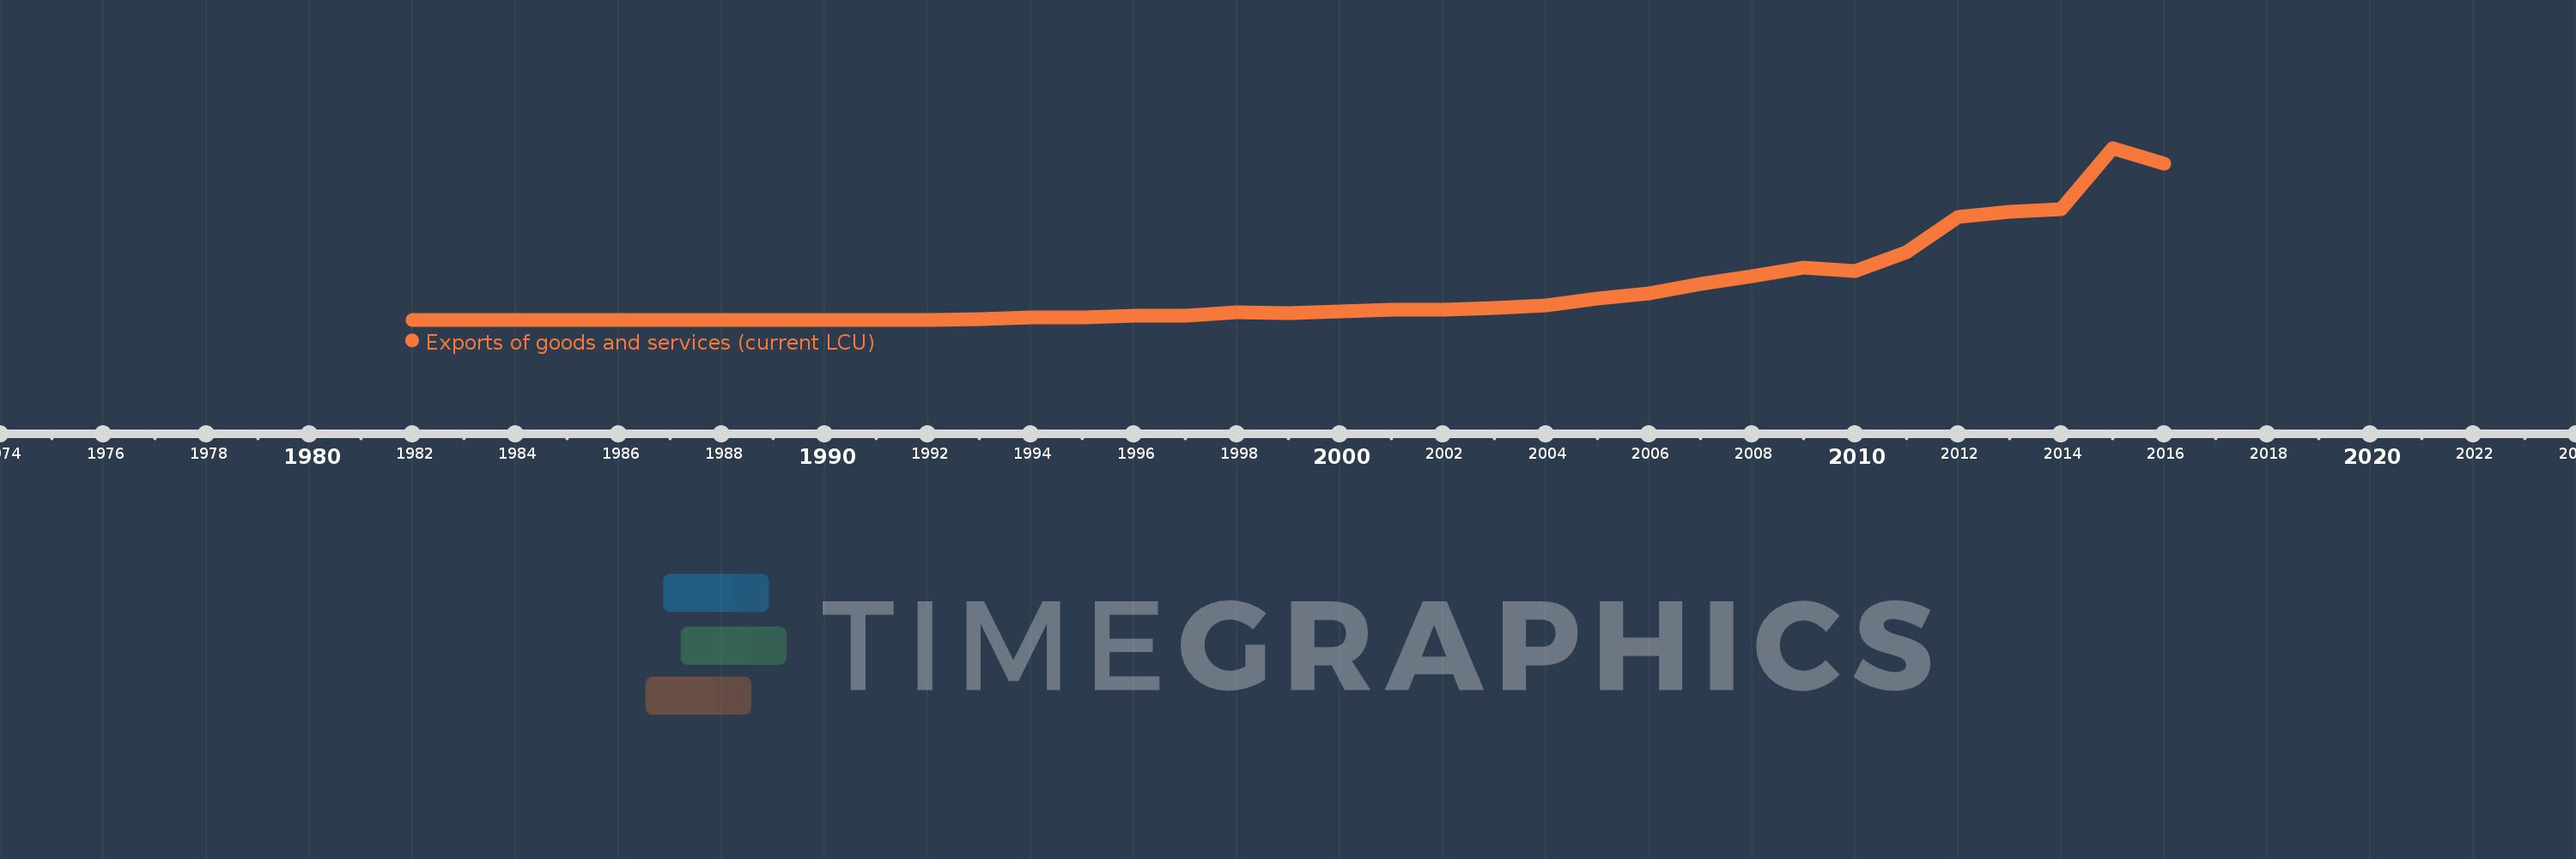
Exports of goods and services (current LCU)
2016,2015,2014,2013,2012,2011,2010,2009,2008,2007,2006,2005,2004,2003,2002,2001,2000,1999,1998,1997,1996,1995,1994,1993,1992,1991,1990,1989,1988,1987,1986,1985,1984,1983,1982
This statistics in other country:
AfghanistanAlbaniaAlgeriaAngolaAntigua and BarbudaArgentinaArmeniaArubaAustraliaAustriaAzerbaijanBahamas, TheBahrainBangladeshBarbadosBelarusBelgiumBelizeBeninBermudaBhutanBoliviaBosnia and HerzegovinaBotswanaBrazilBrunei DarussalamBulgariaBurkina FasoBurundiCabo VerdeCambodiaCameroonCanadaCentral African RepublicChadChileChinaColombiaComorosCongo, Dem. Rep.Congo, Rep.Costa RicaCote d'IvoireCroatiaCubaCyprusCzech RepublicDenmarkDjiboutiDominicaDominican RepublicEcuadorEgypt, Arab Rep.El SalvadorEquatorial GuineaEritreaEstoniaEthiopiaFaroe IslandsFijiFinlandFranceFrench PolynesiaGabonGambia, TheGeorgiaGermanyGhanaGreeceGrenadaGuatemalaGuineaGuinea-BissauGuyanaHaitiHondurasHong Kong SAR, ChinaHungaryIcelandIndiaIndonesiaIran, Islamic Rep.IraqIrelandIsraelItalyJamaicaJapanJordanKazakhstanKenyaKiribatiKorea, Rep.KosovoKuwaitKyrgyz RepublicLao PDRLatviaLebanonLesothoLiberiaLibyaLithuaniaLuxembourgMacao SAR, ChinaMacedonia, FYRMadagascarMalawiMalaysiaMaldivesMaliMaltaMauritaniaMauritiusMexicoMicronesia, Fed. Sts.MoldovaMongoliaMontenegroMoroccoMozambiqueMyanmarNamibiaNepalNetherlandsNew CaledoniaNew ZealandNicaraguaNigerNigeriaNorwayOmanPakistanPalauPanamaPapua New GuineaParaguayPeruPhilippinesPolandPortugalPuerto RicoQatarRomaniaRussian FederationRwandaSamoaSaudi ArabiaSenegalSerbiaSeychellesSierra LeoneSingaporeSlovak RepublicSloveniaSolomon IslandsSomaliaSouth AfricaSouth SudanSpainSri LankaSt. Kitts and NevisSt. LuciaSt. Vincent and the GrenadinesSudanSurinameSwazilandSwedenSwitzerlandSyrian Arab RepublicTajikistanTanzaniaThailandTimor-LesteTogoTongaTrinidad and TobagoTunisiaTurkeyTurkmenistanUgandaUkraineUnited Arab EmiratesUnited KingdomUnited StatesUruguayUzbekistanVanuatuVenezuela, RBVietnamWest Bank and GazaYemen, Rep.ZambiaZimbabwe Timeline:
This timeline shows a graph from 1982 to 2016 of Mongolia. No data until 1981. Number of actual observations by date: 35.
Source name:
World Development Indicators
Source organization:
World Bank national accounts data, and OECD National Accounts data files.
Categories, topics:
Economy & Growth
Last updated:
apr 23, 2017
Indicators value changes by year
Minimum:
1.654 bln
jan 1, 1982
Maximum:
11.613 trl
jan 1, 2015
At the date of observation
Value
Absolute change
Change from previous value
jan 1, 1982
1.654 bln
+1.654 bln
0.0%
jan 1, 1983
2.011 bln
+356.364 mln
21.54%
jan 1, 1984
2.176 bln
+165.119 mln
8.21%
jan 1, 1985
2.45 bln
+273.805 mln
12.58%
jan 1, 1986
2.338 bln
-111.821 mln
-4.56%
jan 1, 1987
2.622 bln
+284.255 mln
12.16%
jan 1, 1988
2.791 bln
+169.299 mln
6.46%
jan 1, 1989
2.735 bln
-56.433 mln
-2.02%
jan 1, 1990
2.413 bln
-321.877 mln
-11.77%
jan 1, 1991
2.34 bln
-73.154 mln
-3.03%
jan 1, 1992
12.22 bln
+9.88 bln
422.24%
jan 1, 1993
16.24 bln
+4.02 bln
32.9%
jan 1, 1994
135.086 bln
+118.846 bln
731.8%
jan 1, 1995
170.535 bln
+35.449 bln
26.24%
jan 1, 1996
264.109 bln
+93.574 bln
54.87%
jan 1, 1997
262.168 bln
-1.941 bln
-0.73%
jan 1, 1998
491.338 bln
+229.17 bln
87.41%
jan 1, 1999
452.342 bln
-38.996 bln
-7.94%
jan 1, 2000
541.978 bln
+89.636 bln
19.82%
jan 1, 2001
660.954 bln
+118.976 bln
21.95%
jan 1, 2002
700.37 bln
+39.416 bln
5.96%
jan 1, 2003
786.572 bln
+86.202 bln
12.31%
jan 1, 2004
957.557 bln
+170.985 bln
21.74%
jan 1, 2005
1.435 trl
+477.738 bln
49.89%
jan 1, 2006
1.787 trl
+352.121 bln
24.53%
jan 1, 2007
2.394 trl
+606.697 bln
33.94%
jan 1, 2008
2.955 trl
+560.766 bln
23.42%
jan 1, 2009
3.541 trl
+586.246 bln
19.84%
jan 1, 2010
3.314 trl
-227.484 bln
-6.42%
jan 1, 2011
4.554 trl
+1.241 trl
37.44%
jan 1, 2012
6.923 trl
+2.369 trl
52.02%
jan 1, 2013
7.272 trl
+348.222 bln
5.03%
jan 1, 2014
7.457 trl
+185.405 bln
2.55%
jan 1, 2015
11.613 trl
+4.157 trl
55.74%
jan 1, 2016
10.567 trl
-1.046 trl
-9.01%
Ranking of countries by current statistics by years


Comments: