29
/
en
AIzaSyAYiBZKx7MnpbEhh9jyipgxe19OcubqV5w
April 1, 2024
182584
Luxembourg
LUX
true
2
1
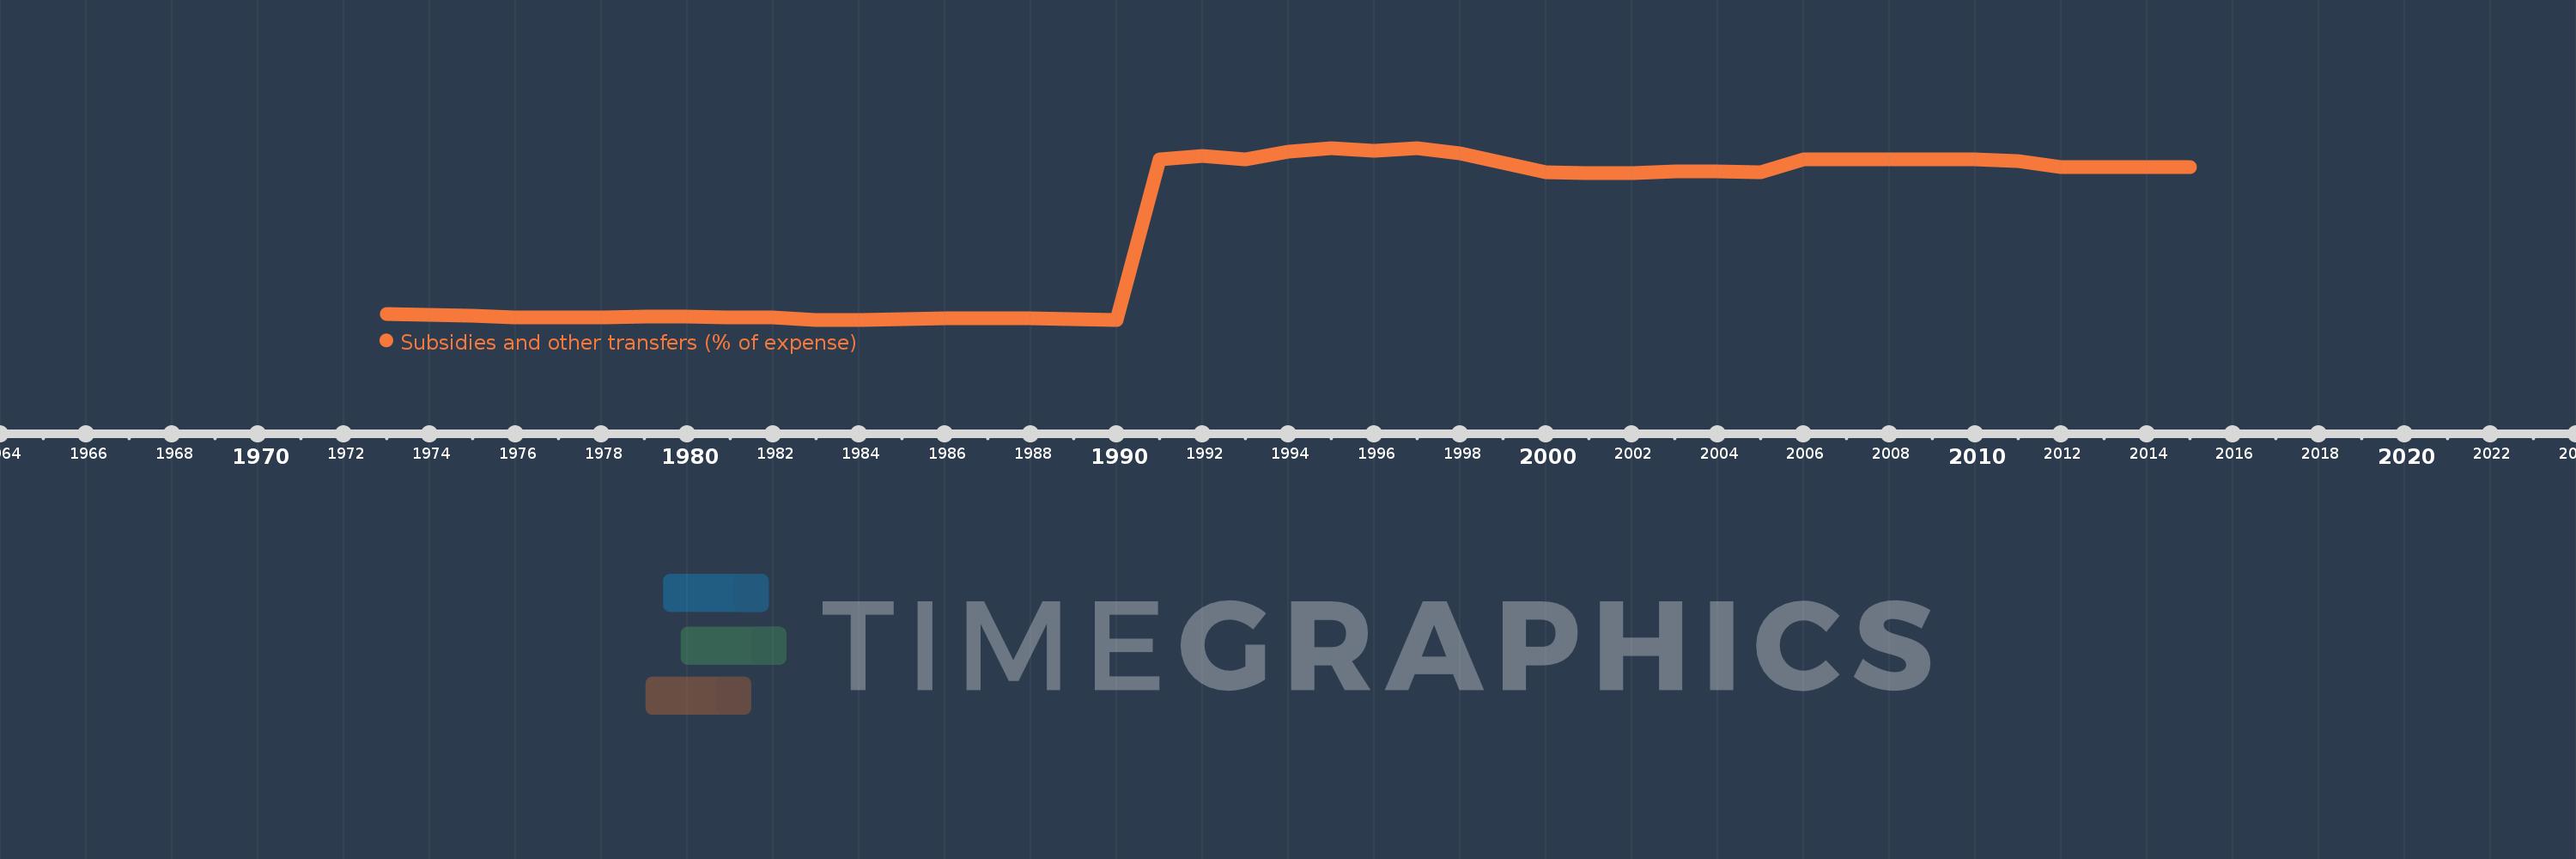
Subsidies and other transfers (% of expense)
2015,2014,2013,2012,2011,2010,2009,2008,2007,2006,2005,2004,2003,2002,2001,2000,1998,1997,1996,1995,1994,1993,1992,1991,1990,1989,1988,1987,1986,1985,1984,1983,1982,1981,1980,1979,1978,1977,1976,1975,1974,1973
This statistics in other country:
AfghanistanAlbaniaAlgeriaAngolaAntigua and BarbudaArab WorldArmeniaAustraliaAustriaAzerbaijanBahamas, TheBahrainBangladeshBarbadosBelarusBelgiumBelizeBeninBhutanBoliviaBosnia and HerzegovinaBotswanaBrazilBulgariaBurkina FasoBurundiCabo VerdeCambodiaCanadaCaribbean small statesCentral African RepublicCentral Europe and the BalticsChileColombiaCongo, Dem. Rep.Congo, Rep.Costa RicaCote d'IvoireCroatiaCyprusCzech RepublicDenmarkDominicaDominican RepublicEarly-demographic dividendEast Asia & PacificEast Asia & Pacific (excluding high income)East Asia & Pacific (IDA & IBRD countries)Egypt, Arab Rep.El SalvadorEquatorial GuineaEstoniaEthiopiaEuro areaEurope & Central AsiaEurope & Central Asia (excluding high income)Europe & Central Asia (IDA & IBRD countries)European UnionFijiFinlandFranceGambia, TheGeorgiaGermanyGhanaGreeceGrenadaGuatemalaHeavily indebted poor countries (HIPC)High incomeHondurasHong Kong SAR, ChinaHungaryIBRD onlyIcelandIDA & IBRD totalIDA blendIDA onlyIDA totalIndiaIndonesiaIran, Islamic Rep.IraqIrelandIsraelItalyJamaicaJapanJordanKazakhstanKenyaKiribatiKorea, Rep.KuwaitKyrgyz RepublicLao PDRLate-demographic dividendLatin America & Caribbean Latin America & Caribbean (excluding high income)Latin America & the Caribbean (IDA & IBRD countries)LatviaLeast developed countries: UN classificationLebanonLesothoLiberiaLithuaniaLow & middle incomeLow incomeLower middle incomeLuxembourgMacao SAR, ChinaMacedonia, FYRMadagascarMalawiMalaysiaMaldivesMaliMaltaMauritiusMicronesia, Fed. Sts.Middle East & North AfricaMiddle East & North Africa (excluding high income)Middle East & North Africa (IDA & IBRD countries)Middle incomeMoldovaMongoliaMoroccoMozambiqueNamibiaNepalNetherlandsNew ZealandNicaraguaNigeriaNorth AmericaNorwayOECD membersOmanOther small statesPakistanPanamaPapua New GuineaParaguayPeruPhilippinesPolandPortugalPost-demographic dividendPre-demographic dividendQatarRomaniaRussian FederationRwandaSamoaSan MarinoSao Tome and PrincipeSenegalSerbiaSeychellesSierra LeoneSingaporeSlovak RepublicSloveniaSmall statesSolomon IslandsSouth AfricaSouth AsiaSouth Asia (IDA & IBRD)SpainSri LankaSt. Kitts and NevisSt. LuciaSub-Saharan Africa Sub-Saharan Africa (excluding high income)Sub-Saharan Africa (IDA & IBRD countries)SurinameSwazilandSwedenSwitzerlandSyrian Arab RepublicTajikistanTanzaniaThailandTimor-LesteTogoTrinidad and TobagoTunisiaTurkeyUgandaUkraineUnited Arab EmiratesUnited KingdomUnited StatesUpper middle incomeUruguayVanuatuVenezuela, RBWest Bank and GazaWorldYemen, Rep.ZambiaZimbabwe Timeline:
This timeline shows a graph from 1973 to 2015 of Luxembourg. No data until 1972. Number of actual observations by date: 42.
Source name:
World Development Indicators
Source organization:
International Monetary Fund, Government Finance Statistics Yearbook and data files.
Categories, topics:
Public Sector
Last updated:
apr 23, 2017
Indicators value changes by year
Maximum:
74.759
jan 1, 1995
At the date of observation
Value
Absolute change
Change from previous value
jan 1, 1973
3.453
+3.453
0.0%
jan 1, 1974
3.169
-0.284
-8.23%
jan 1, 1975
2.682
-0.487
-15.37%
jan 1, 1976
2.098
-0.584
-21.77%
jan 1, 1977
1.999
-0.099
-4.71%
jan 1, 1978
2.074
+0.075
3.73%
jan 1, 1979
2.275
+0.201
9.69%
jan 1, 1980
2.198
-0.077
-3.37%
jan 1, 1981
2.078
-0.12
-5.48%
jan 1, 1982
2.049
-0.029
-1.39%
jan 1, 1983
0.978
-1.071
-52.28%
jan 1, 1984
1.029
+0.052
5.28%
jan 1, 1985
1.305
+0.275
26.76%
jan 1, 1986
1.556
+0.252
19.29%
jan 1, 1987
1.523
-0.034
-2.18%
jan 1, 1988
1.616
+0.094
6.15%
jan 1, 1989
1.201
-0.415
-25.69%
jan 1, 1990
0.993
-0.208
-17.28%
jan 1, 1991
69.882
+68.888
6.94K%
jan 1, 1992
71.356
+1.474
2.11%
jan 1, 1993
69.69
-1.666
-2.33%
jan 1, 1994
73.198
+3.508
5.03%
jan 1, 1995
74.759
+1.561
2.13%
jan 1, 1996
73.437
-1.323
-1.77%
jan 1, 1997
74.652
+1.216
1.66%
jan 1, 1998
72.514
-2.138
-2.86%
jan 1, 2000
64.163
-8.351
-11.52%
jan 1, 2001
63.984
-0.18
-0.28%
jan 1, 2002
64.045
+0.062
0.1%
jan 1, 2003
64.709
+0.663
1.04%
jan 1, 2004
64.546
-0.163
-0.25%
jan 1, 2005
64.419
-0.127
-0.2%
jan 1, 2006
69.876
+5.457
8.47%
jan 1, 2007
69.862
-0.014
-0.02%
jan 1, 2008
69.807
-0.055
-0.08%
jan 1, 2009
70.014
+0.207
0.3%
jan 1, 2010
69.852
-0.162
-0.23%
jan 1, 2011
69.044
-0.808
-1.16%
jan 1, 2012
66.624
-2.42
-3.51%
jan 1, 2013
66.564
-0.06
-0.09%
jan 1, 2014
66.492
-0.072
-0.11%
jan 1, 2015
66.512
+0.021
0.03%
Ranking of countries by current statistics by years


Comments: