29
/
en
AIzaSyAYiBZKx7MnpbEhh9jyipgxe19OcubqV5w
April 1, 2024
278290
Uruguay
URY
true
2
1
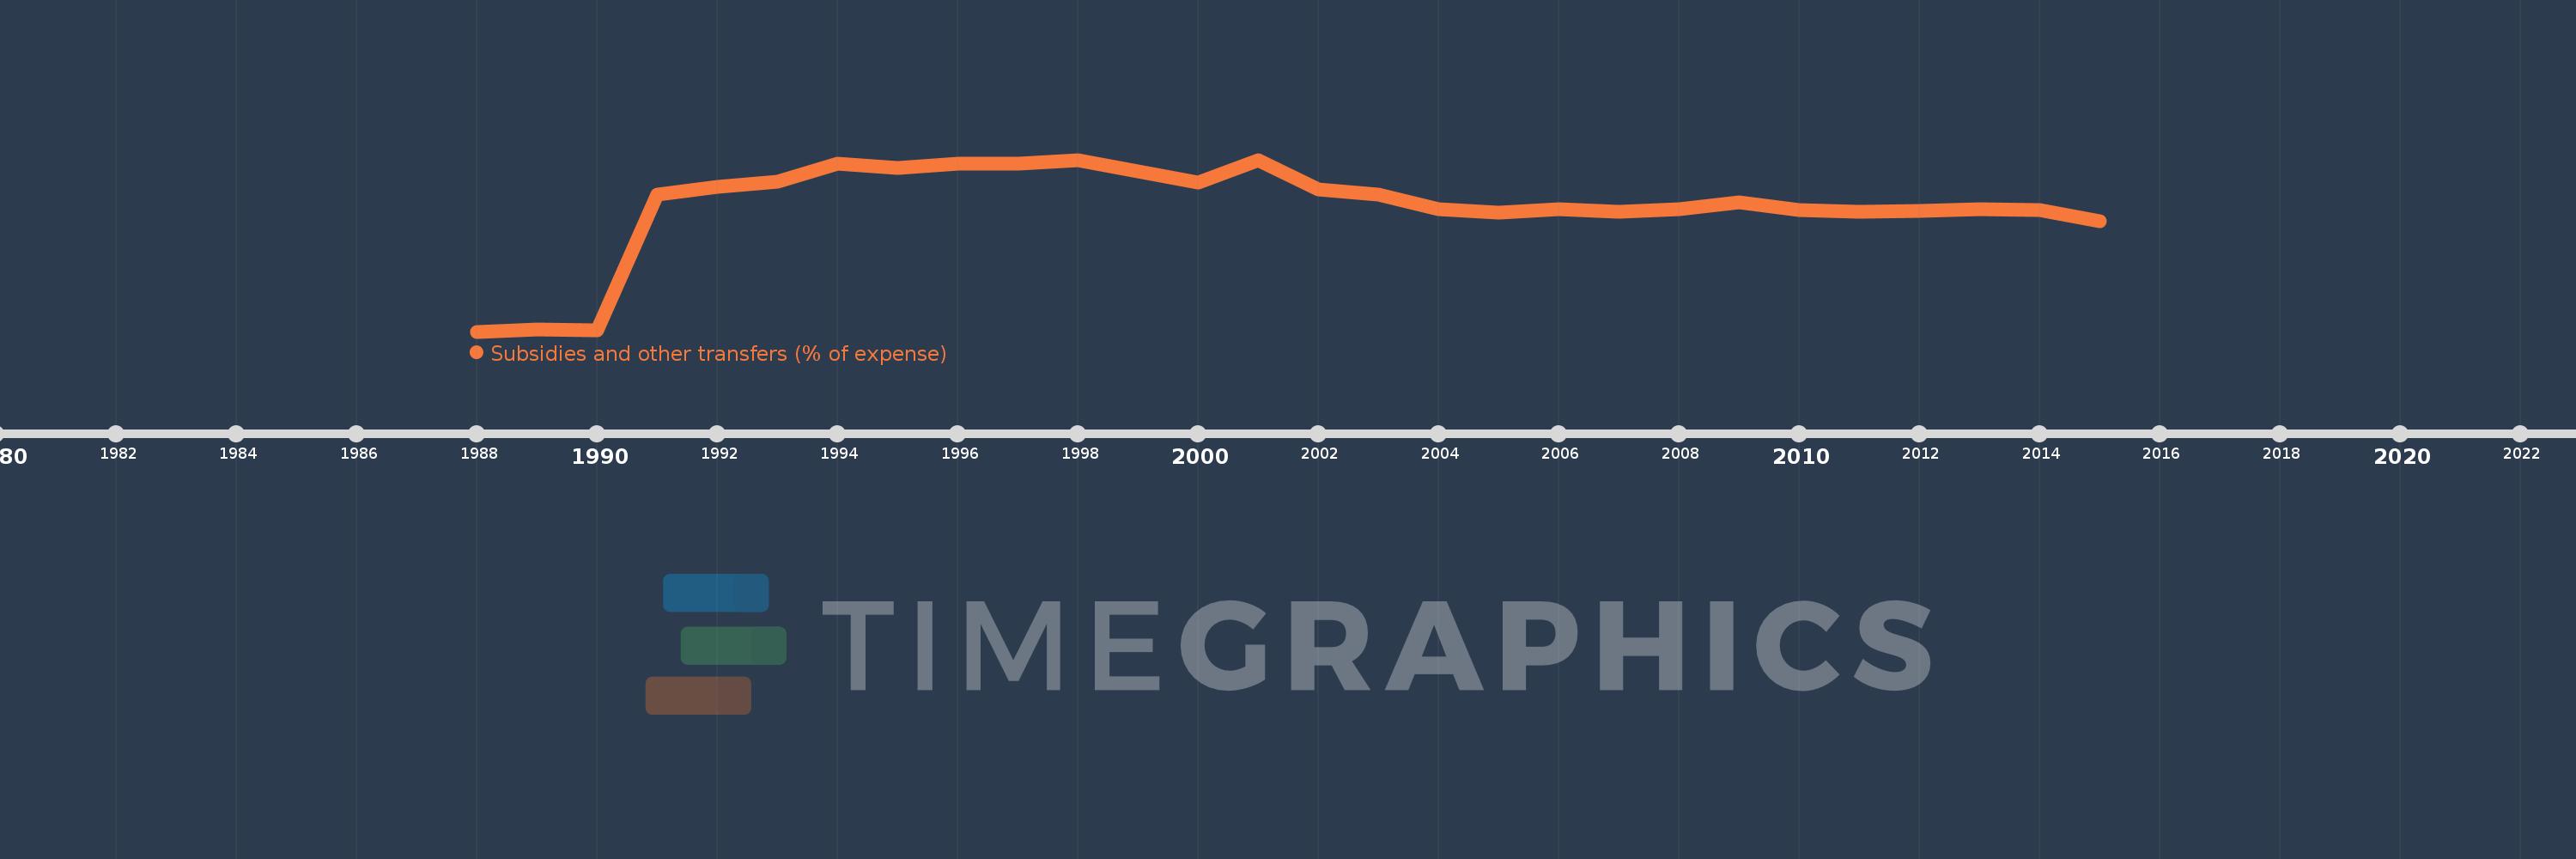
Subsidies and other transfers (% of expense)
2015,2014,2013,2012,2011,2010,2009,2008,2007,2006,2005,2004,2003,2002,2001,2000,1999,1998,1997,1996,1995,1994,1993,1992,1991,1990,1989,1988
This statistics in other country:
AfghanistanAlbaniaAlgeriaAngolaAntigua and BarbudaArab WorldArmeniaAustraliaAustriaAzerbaijanBahamas, TheBahrainBangladeshBarbadosBelarusBelgiumBelizeBeninBhutanBoliviaBosnia and HerzegovinaBotswanaBrazilBulgariaBurkina FasoBurundiCabo VerdeCambodiaCanadaCaribbean small statesCentral African RepublicCentral Europe and the BalticsChileColombiaCongo, Dem. Rep.Congo, Rep.Costa RicaCote d'IvoireCroatiaCyprusCzech RepublicDenmarkDominicaDominican RepublicEarly-demographic dividendEast Asia & PacificEast Asia & Pacific (excluding high income)East Asia & Pacific (IDA & IBRD countries)Egypt, Arab Rep.El SalvadorEquatorial GuineaEstoniaEthiopiaEuro areaEurope & Central AsiaEurope & Central Asia (excluding high income)Europe & Central Asia (IDA & IBRD countries)European UnionFijiFinlandFranceGambia, TheGeorgiaGermanyGhanaGreeceGrenadaGuatemalaHeavily indebted poor countries (HIPC)High incomeHondurasHong Kong SAR, ChinaHungaryIBRD onlyIcelandIDA & IBRD totalIDA blendIDA onlyIDA totalIndiaIndonesiaIran, Islamic Rep.IraqIrelandIsraelItalyJamaicaJapanJordanKazakhstanKenyaKiribatiKorea, Rep.KuwaitKyrgyz RepublicLao PDRLate-demographic dividendLatin America & Caribbean Latin America & Caribbean (excluding high income)Latin America & the Caribbean (IDA & IBRD countries)LatviaLeast developed countries: UN classificationLebanonLesothoLiberiaLithuaniaLow & middle incomeLow incomeLower middle incomeLuxembourgMacao SAR, ChinaMacedonia, FYRMadagascarMalawiMalaysiaMaldivesMaliMaltaMauritiusMicronesia, Fed. Sts.Middle East & North AfricaMiddle East & North Africa (excluding high income)Middle East & North Africa (IDA & IBRD countries)Middle incomeMoldovaMongoliaMoroccoMozambiqueNamibiaNepalNetherlandsNew ZealandNicaraguaNigeriaNorth AmericaNorwayOECD membersOmanOther small statesPakistanPanamaPapua New GuineaParaguayPeruPhilippinesPolandPortugalPost-demographic dividendPre-demographic dividendQatarRomaniaRussian FederationRwandaSamoaSan MarinoSao Tome and PrincipeSenegalSerbiaSeychellesSierra LeoneSingaporeSlovak RepublicSloveniaSmall statesSolomon IslandsSouth AfricaSouth AsiaSouth Asia (IDA & IBRD)SpainSri LankaSt. Kitts and NevisSt. LuciaSub-Saharan Africa Sub-Saharan Africa (excluding high income)Sub-Saharan Africa (IDA & IBRD countries)SurinameSwazilandSwedenSwitzerlandSyrian Arab RepublicTajikistanTanzaniaThailandTimor-LesteTogoTrinidad and TobagoTunisiaTurkeyUgandaUkraineUnited Arab EmiratesUnited KingdomUnited StatesUpper middle incomeUruguayVanuatuVenezuela, RBWest Bank and GazaWorldYemen, Rep.ZambiaZimbabwe Timeline:
This timeline shows a graph from 1988 to 2015 of Uruguay. No data until 1987. Number of actual observations by date: 28.
Source name:
World Development Indicators
Source organization:
International Monetary Fund, Government Finance Statistics Yearbook and data files.
Categories, topics:
Public Sector
Last updated:
apr 23, 2017
Indicators value changes by year
At the date of observation
Value
Absolute change
Change from previous value
jan 1, 1988
2.132
+2.132
0.0%
jan 1, 1989
3.081
+0.948
44.47%
jan 1, 1990
2.502
-0.578
-18.78%
jan 1, 1991
52.875
+50.372
2.01K%
jan 1, 1992
55.85
+2.976
5.63%
jan 1, 1993
57.645
+1.795
3.21%
jan 1, 1994
64.35
+6.705
11.63%
jan 1, 1995
62.798
-1.553
-2.41%
jan 1, 1996
64.367
+1.57
2.5%
jan 1, 1997
64.342
-0.025
-0.04%
jan 1, 1998
65.433
+1.091
1.7%
jan 1, 1999
61.357
-4.076
-6.23%
jan 1, 2000
57.426
-3.931
-6.41%
jan 1, 2001
65.73
+8.304
14.46%
jan 1, 2002
54.78
-10.951
-16.66%
jan 1, 2003
52.765
-2.014
-3.68%
jan 1, 2004
47.392
-5.373
-10.18%
jan 1, 2005
46.175
-1.217
-2.57%
jan 1, 2006
47.318
+1.143
2.48%
jan 1, 2007
46.429
-0.889
-1.88%
jan 1, 2008
47.578
+1.149
2.47%
jan 1, 2009
50.131
+2.553
5.37%
jan 1, 2010
47.01
-3.121
-6.23%
jan 1, 2011
46.481
-0.529
-1.13%
jan 1, 2012
46.851
+0.37
0.8%
jan 1, 2013
47.524
+0.673
1.44%
jan 1, 2014
47.196
-0.328
-0.69%
jan 1, 2015
42.944
-4.252
-9.01%
Ranking of countries by current statistics by years


Comments: