29
/
en
AIzaSyAYiBZKx7MnpbEhh9jyipgxe19OcubqV5w
April 1, 2024
238767
Seychelles
SYC
true
2
1
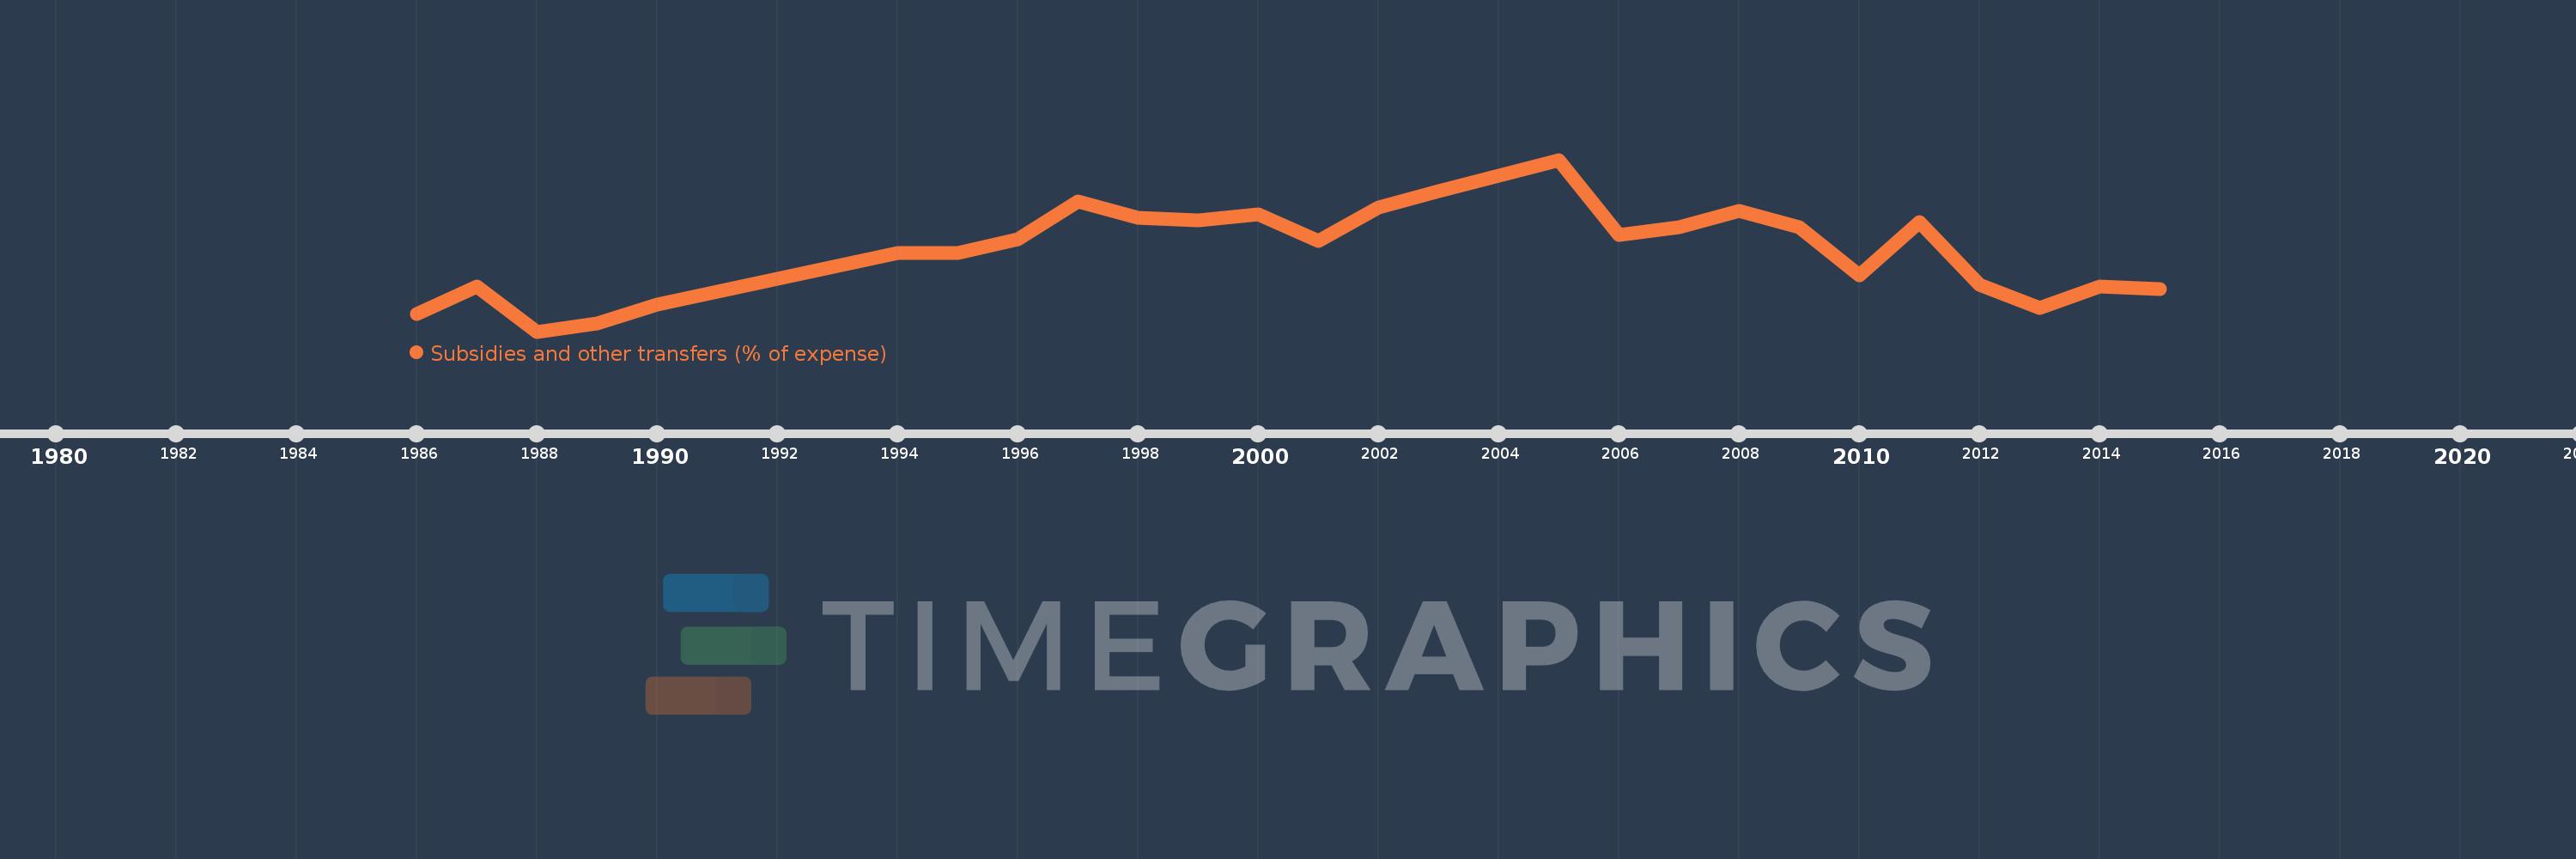
Subsidies and other transfers (% of expense)
2015,2014,2013,2012,2011,2010,2009,2008,2007,2006,2005,2004,2003,2002,2001,2000,1999,1998,1997,1996,1995,1994,1990,1989,1988,1987,1986
This statistics in other country:
AfghanistanAlbaniaAlgeriaAngolaAntigua and BarbudaArab WorldArmeniaAustraliaAustriaAzerbaijanBahamas, TheBahrainBangladeshBarbadosBelarusBelgiumBelizeBeninBhutanBoliviaBosnia and HerzegovinaBotswanaBrazilBulgariaBurkina FasoBurundiCabo VerdeCambodiaCanadaCaribbean small statesCentral African RepublicCentral Europe and the BalticsChileColombiaCongo, Dem. Rep.Congo, Rep.Costa RicaCote d'IvoireCroatiaCyprusCzech RepublicDenmarkDominicaDominican RepublicEarly-demographic dividendEast Asia & PacificEast Asia & Pacific (excluding high income)East Asia & Pacific (IDA & IBRD countries)Egypt, Arab Rep.El SalvadorEquatorial GuineaEstoniaEthiopiaEuro areaEurope & Central AsiaEurope & Central Asia (excluding high income)Europe & Central Asia (IDA & IBRD countries)European UnionFijiFinlandFranceGambia, TheGeorgiaGermanyGhanaGreeceGrenadaGuatemalaHeavily indebted poor countries (HIPC)High incomeHondurasHong Kong SAR, ChinaHungaryIBRD onlyIcelandIDA & IBRD totalIDA blendIDA onlyIDA totalIndiaIndonesiaIran, Islamic Rep.IraqIrelandIsraelItalyJamaicaJapanJordanKazakhstanKenyaKiribatiKorea, Rep.KuwaitKyrgyz RepublicLao PDRLate-demographic dividendLatin America & Caribbean Latin America & Caribbean (excluding high income)Latin America & the Caribbean (IDA & IBRD countries)LatviaLeast developed countries: UN classificationLebanonLesothoLiberiaLithuaniaLow & middle incomeLow incomeLower middle incomeLuxembourgMacao SAR, ChinaMacedonia, FYRMadagascarMalawiMalaysiaMaldivesMaliMaltaMauritiusMicronesia, Fed. Sts.Middle East & North AfricaMiddle East & North Africa (excluding high income)Middle East & North Africa (IDA & IBRD countries)Middle incomeMoldovaMongoliaMoroccoMozambiqueNamibiaNepalNetherlandsNew ZealandNicaraguaNigeriaNorth AmericaNorwayOECD membersOmanOther small statesPakistanPanamaPapua New GuineaParaguayPeruPhilippinesPolandPortugalPost-demographic dividendPre-demographic dividendQatarRomaniaRussian FederationRwandaSamoaSan MarinoSao Tome and PrincipeSenegalSerbiaSeychellesSierra LeoneSingaporeSlovak RepublicSloveniaSmall statesSolomon IslandsSouth AfricaSouth AsiaSouth Asia (IDA & IBRD)SpainSri LankaSt. Kitts and NevisSt. LuciaSub-Saharan Africa Sub-Saharan Africa (excluding high income)Sub-Saharan Africa (IDA & IBRD countries)SurinameSwazilandSwedenSwitzerlandSyrian Arab RepublicTajikistanTanzaniaThailandTimor-LesteTogoTrinidad and TobagoTunisiaTurkeyUgandaUkraineUnited Arab EmiratesUnited KingdomUnited StatesUpper middle incomeUruguayVanuatuVenezuela, RBWest Bank and GazaWorldYemen, Rep.ZambiaZimbabwe Timeline:
This timeline shows a graph from 1986 to 2015 of Seychelles. No data until 1985. Number of actual observations by date: 27.
Source name:
World Development Indicators
Source organization:
International Monetary Fund, Government Finance Statistics Yearbook and data files.
Categories, topics:
Public Sector
Last updated:
apr 23, 2017
Indicators value changes by year
Maximum:
35.666
jan 1, 2005
At the date of observation
Value
Absolute change
Change from previous value
jan 1, 1986
9.241
+9.241
0.0%
jan 1, 1987
13.908
+4.666
50.5%
jan 1, 1988
6.226
-7.682
-55.23%
jan 1, 1989
7.559
+1.333
21.42%
jan 1, 1990
10.823
+3.264
43.18%
jan 1, 1994
19.721
+8.898
82.21%
jan 1, 1995
19.733
+0.012
0.06%
jan 1, 1996
22.078
+2.345
11.88%
jan 1, 1997
28.501
+6.423
29.09%
jan 1, 1998
25.671
-2.831
-9.93%
jan 1, 1999
25.325
-0.345
-1.35%
jan 1, 2000
26.322
+0.997
3.94%
jan 1, 2001
21.768
-4.555
-17.3%
jan 1, 2002
27.569
+5.802
26.65%
jan 1, 2003
30.251
+2.682
9.73%
jan 1, 2004
32.947
+2.696
8.91%
jan 1, 2005
35.666
+2.719
8.25%
jan 1, 2006
22.724
-12.943
-36.29%
jan 1, 2007
24.129
+1.405
6.18%
jan 1, 2008
26.929
+2.8
11.6%
jan 1, 2009
24.089
-2.839
-10.54%
jan 1, 2010
15.814
-8.275
-34.35%
jan 1, 2011
25.019
+9.205
58.21%
jan 1, 2012
14.225
-10.794
-43.14%
jan 1, 2013
10.219
-4.007
-28.17%
jan 1, 2014
14.009
+3.791
37.1%
jan 1, 2015
13.452
-0.558
-3.98%
Ranking of countries by current statistics by years


Comments: