29
/
en
AIzaSyAYiBZKx7MnpbEhh9jyipgxe19OcubqV5w
April 1, 2024
117439
Cyprus
CYP
true
2
1
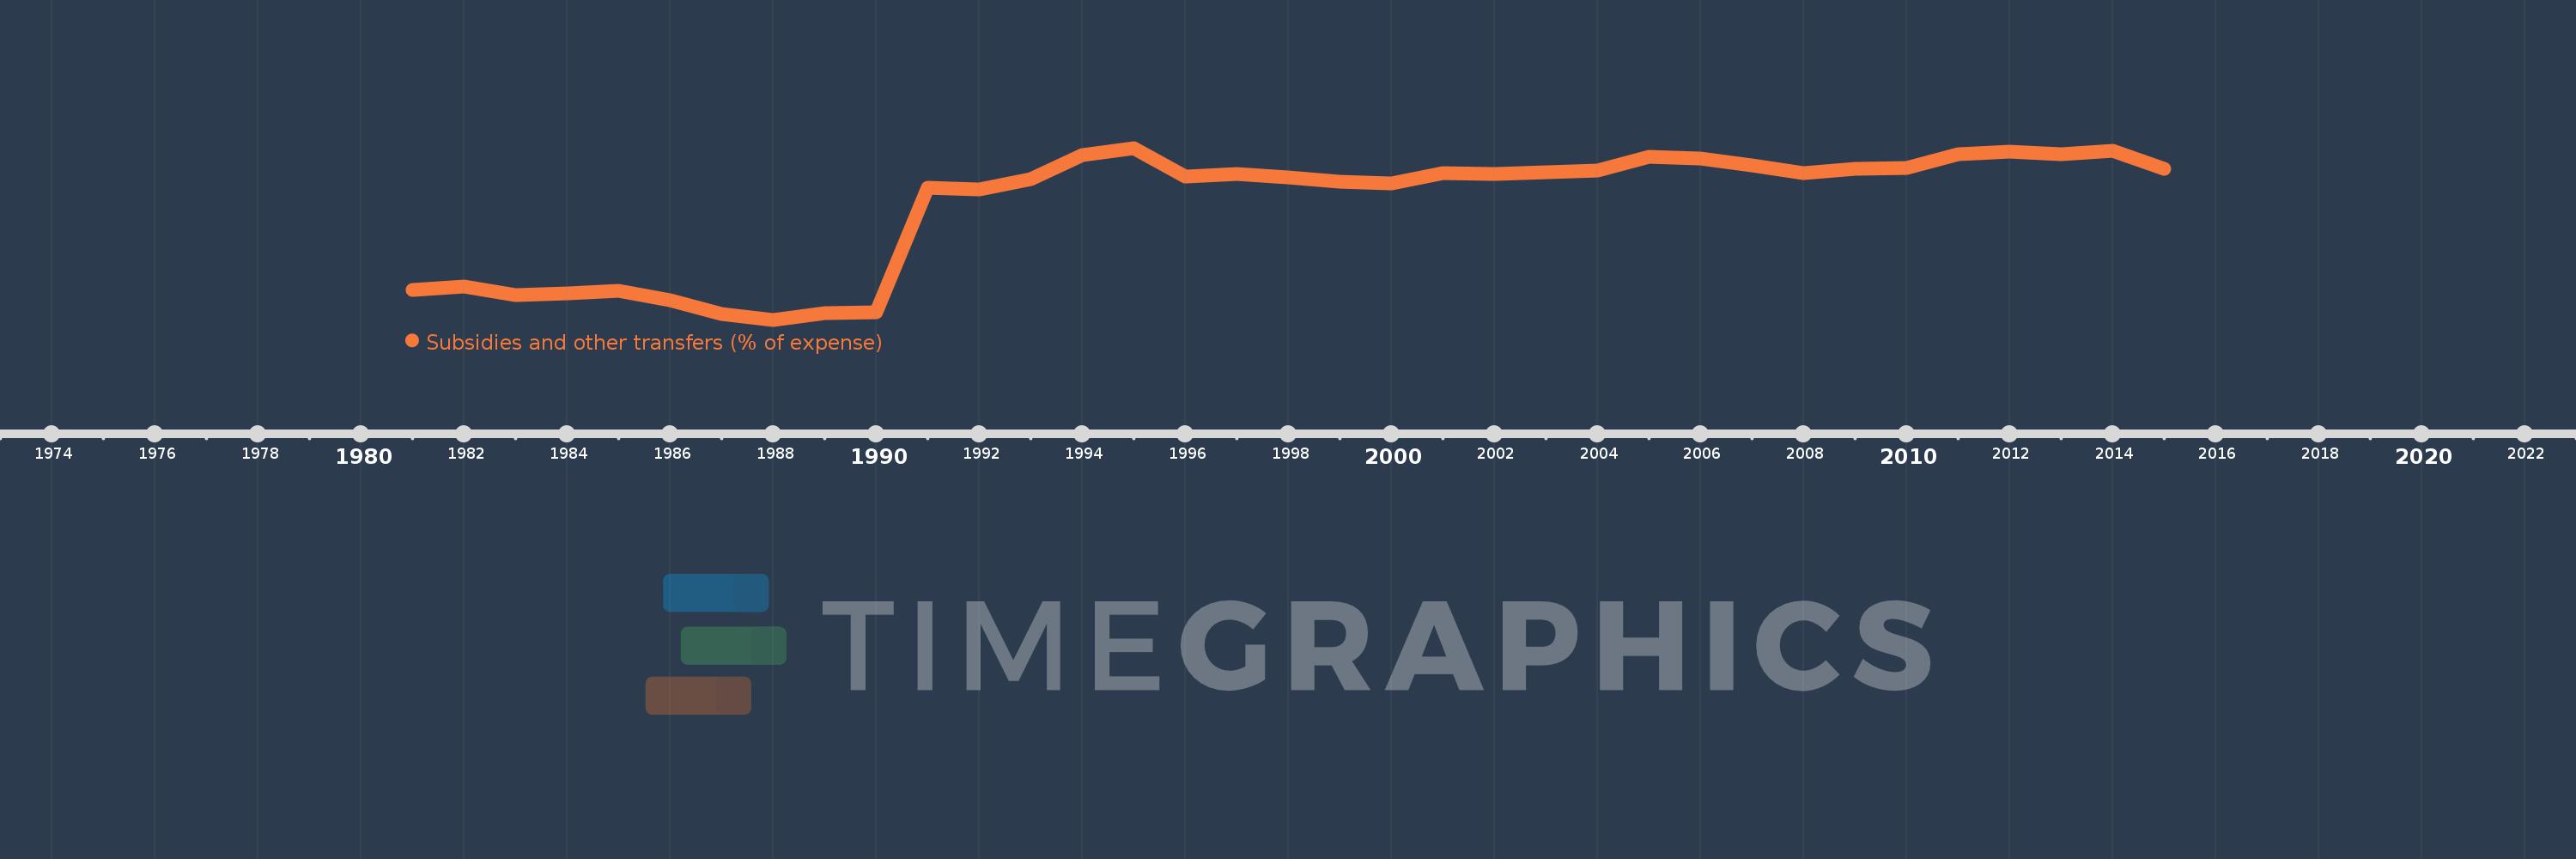
Subsidies and other transfers (% of expense)
2015,2014,2013,2012,2011,2010,2009,2008,2007,2006,2005,2004,2003,2002,2001,2000,1999,1998,1997,1996,1995,1994,1993,1992,1991,1990,1989,1988,1987,1986,1985,1984,1983,1982,1981
This statistics in other country:
AfghanistanAlbaniaAlgeriaAngolaAntigua and BarbudaArab WorldArmeniaAustraliaAustriaAzerbaijanBahamas, TheBahrainBangladeshBarbadosBelarusBelgiumBelizeBeninBhutanBoliviaBosnia and HerzegovinaBotswanaBrazilBulgariaBurkina FasoBurundiCabo VerdeCambodiaCanadaCaribbean small statesCentral African RepublicCentral Europe and the BalticsChileColombiaCongo, Dem. Rep.Congo, Rep.Costa RicaCote d'IvoireCroatiaCyprusCzech RepublicDenmarkDominicaDominican RepublicEarly-demographic dividendEast Asia & PacificEast Asia & Pacific (excluding high income)East Asia & Pacific (IDA & IBRD countries)Egypt, Arab Rep.El SalvadorEquatorial GuineaEstoniaEthiopiaEuro areaEurope & Central AsiaEurope & Central Asia (excluding high income)Europe & Central Asia (IDA & IBRD countries)European UnionFijiFinlandFranceGambia, TheGeorgiaGermanyGhanaGreeceGrenadaGuatemalaHeavily indebted poor countries (HIPC)High incomeHondurasHong Kong SAR, ChinaHungaryIBRD onlyIcelandIDA & IBRD totalIDA blendIDA onlyIDA totalIndiaIndonesiaIran, Islamic Rep.IraqIrelandIsraelItalyJamaicaJapanJordanKazakhstanKenyaKiribatiKorea, Rep.KuwaitKyrgyz RepublicLao PDRLate-demographic dividendLatin America & Caribbean Latin America & Caribbean (excluding high income)Latin America & the Caribbean (IDA & IBRD countries)LatviaLeast developed countries: UN classificationLebanonLesothoLiberiaLithuaniaLow & middle incomeLow incomeLower middle incomeLuxembourgMacao SAR, ChinaMacedonia, FYRMadagascarMalawiMalaysiaMaldivesMaliMaltaMauritiusMicronesia, Fed. Sts.Middle East & North AfricaMiddle East & North Africa (excluding high income)Middle East & North Africa (IDA & IBRD countries)Middle incomeMoldovaMongoliaMoroccoMozambiqueNamibiaNepalNetherlandsNew ZealandNicaraguaNigeriaNorth AmericaNorwayOECD membersOmanOther small statesPakistanPanamaPapua New GuineaParaguayPeruPhilippinesPolandPortugalPost-demographic dividendPre-demographic dividendQatarRomaniaRussian FederationRwandaSamoaSan MarinoSao Tome and PrincipeSenegalSerbiaSeychellesSierra LeoneSingaporeSlovak RepublicSloveniaSmall statesSolomon IslandsSouth AfricaSouth AsiaSouth Asia (IDA & IBRD)SpainSri LankaSt. Kitts and NevisSt. LuciaSub-Saharan Africa Sub-Saharan Africa (excluding high income)Sub-Saharan Africa (IDA & IBRD countries)SurinameSwazilandSwedenSwitzerlandSyrian Arab RepublicTajikistanTanzaniaThailandTimor-LesteTogoTrinidad and TobagoTunisiaTurkeyUgandaUkraineUnited Arab EmiratesUnited KingdomUnited StatesUpper middle incomeUruguayVanuatuVenezuela, RBWest Bank and GazaWorldYemen, Rep.ZambiaZimbabwe Timeline:
This timeline shows a graph from 1981 to 2015 of Cyprus. No data until 1980. Number of actual observations by date: 35.
Source name:
World Development Indicators
Source organization:
International Monetary Fund, Government Finance Statistics Yearbook and data files.
Categories, topics:
Public Sector
Last updated:
apr 23, 2017
Indicators value changes by year
Maximum:
35.545
jan 1, 1995
At the date of observation
Value
Absolute change
Change from previous value
jan 1, 1981
9.273
+9.273
0.0%
jan 1, 1982
9.996
+0.723
7.8%
jan 1, 1983
8.363
-1.633
-16.34%
jan 1, 1984
8.742
+0.379
4.53%
jan 1, 1985
9.189
+0.447
5.12%
jan 1, 1986
7.434
-1.756
-19.1%
jan 1, 1987
4.971
-2.463
-33.13%
jan 1, 1988
3.852
-1.119
-22.52%
jan 1, 1989
5.089
+1.238
32.13%
jan 1, 1990
5.262
+0.173
3.4%
jan 1, 1991
28.278
+23.016
437.39%
jan 1, 1992
27.86
-0.418
-1.48%
jan 1, 1993
29.789
+1.929
6.92%
jan 1, 1994
34.194
+4.405
14.79%
jan 1, 1995
35.545
+1.352
3.95%
jan 1, 1996
30.225
-5.32
-14.97%
jan 1, 1997
30.8
+0.575
1.9%
jan 1, 1998
30.056
-0.744
-2.42%
jan 1, 1999
29.331
-0.725
-2.41%
jan 1, 2000
28.99
-0.341
-1.16%
jan 1, 2001
30.866
+1.877
6.47%
jan 1, 2002
30.79
-0.076
-0.25%
jan 1, 2003
31.139
+0.349
1.13%
jan 1, 2004
31.331
+0.192
0.62%
jan 1, 2005
33.962
+2.632
8.4%
jan 1, 2006
33.533
-0.43
-1.27%
jan 1, 2007
32.301
-1.232
-3.67%
jan 1, 2008
30.85
-1.451
-4.49%
jan 1, 2009
31.64
+0.79
2.56%
jan 1, 2010
31.927
+0.287
0.91%
jan 1, 2011
34.404
+2.477
7.76%
jan 1, 2012
34.819
+0.415
1.21%
jan 1, 2013
34.463
-0.355
-1.02%
jan 1, 2014
34.994
+0.531
1.54%
jan 1, 2015
31.679
-3.315
-9.47%
Ranking of countries by current statistics by years


Comments: