29
/
en
AIzaSyAYiBZKx7MnpbEhh9jyipgxe19OcubqV5w
April 1, 2024
168026
Kenya
KEN
true
2
1
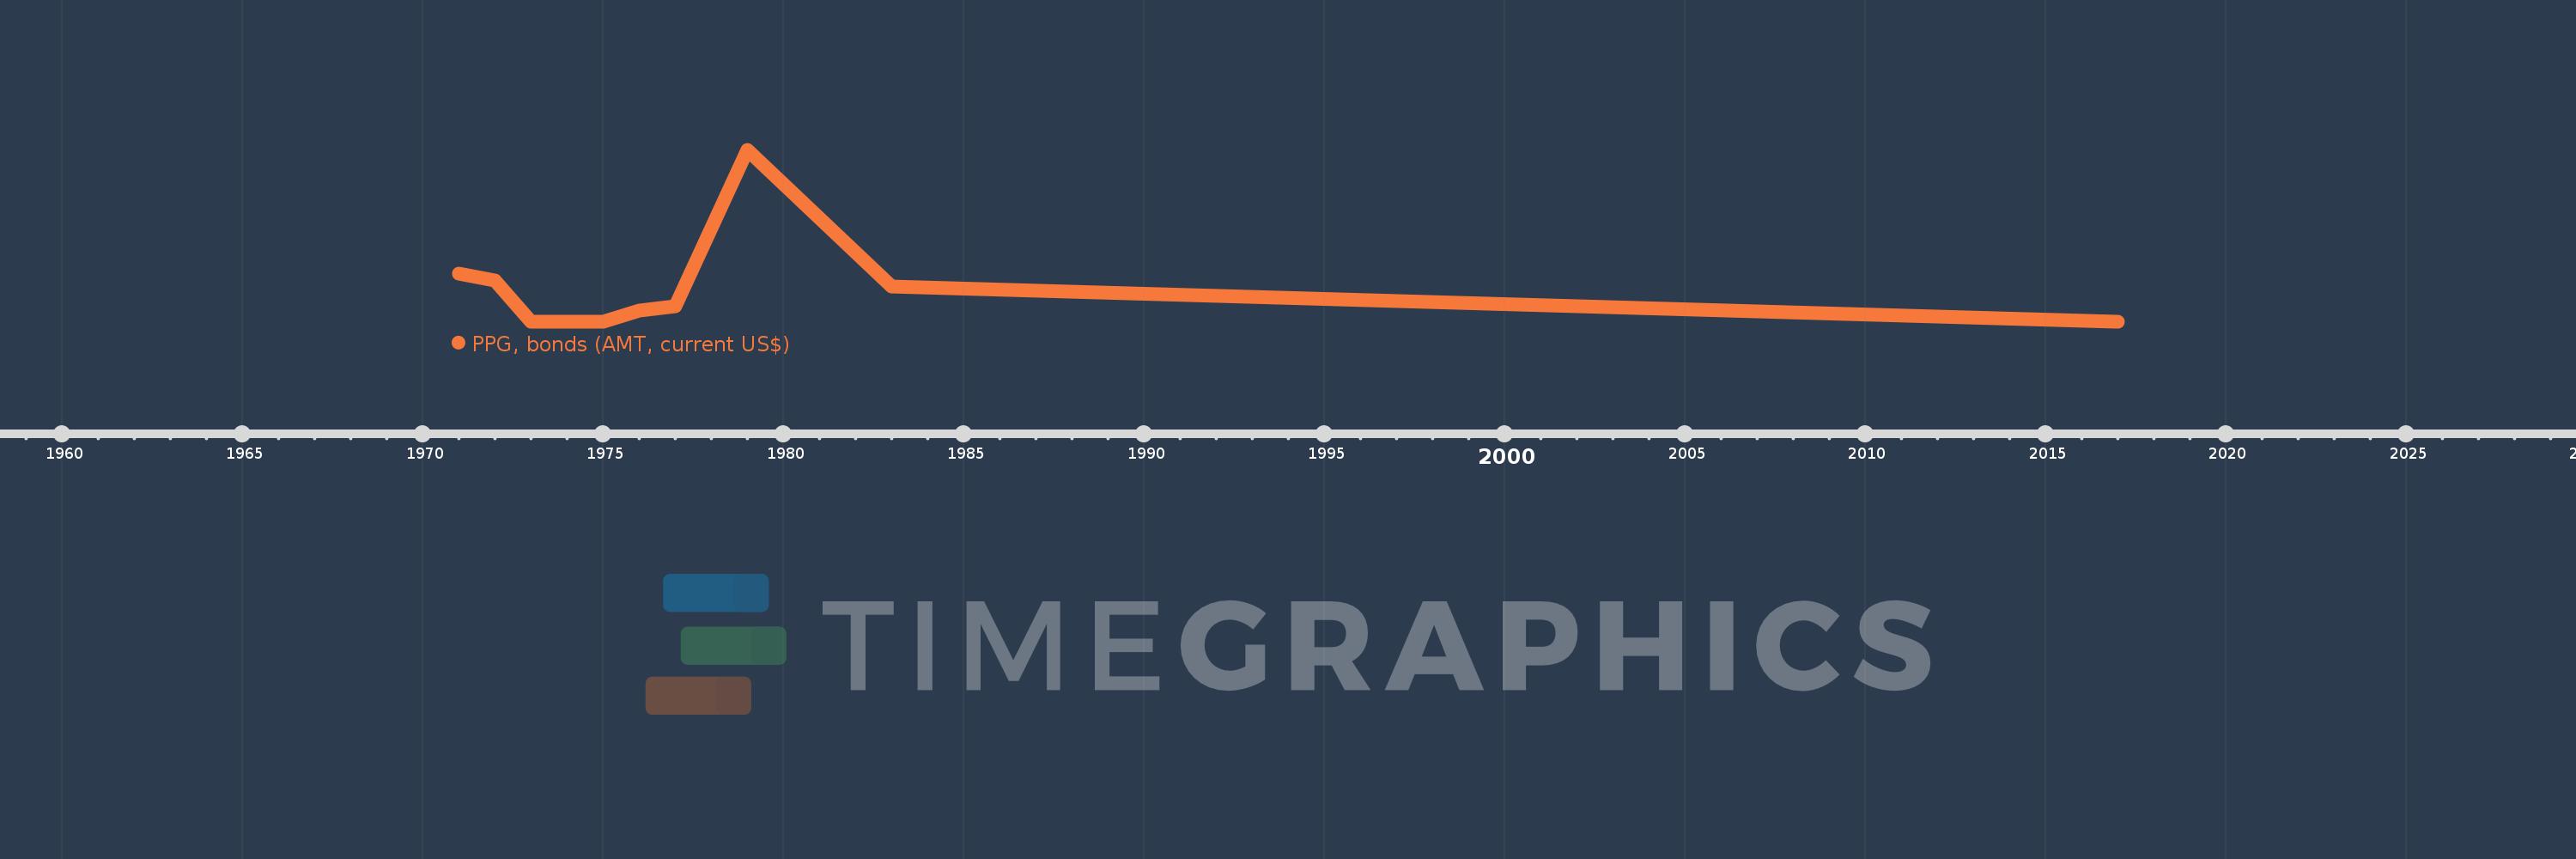
PPG, bonds (AMT, current US$)
2017,1983,1979,1977,1976,1975,1974,1973,1972,1971
This statistics in other country:
Timeline:
This timeline shows a graph from 1971 to 2017 of Kenya. No data until 1970. Number of actual observations by date: 10.
Source name:
World Development Indicators
Source organization:
World Bank, International Debt Statistics.
Categories, topics:
External Debt
Last updated:
apr 23, 2017
Indicators value changes by year
Maximum:
35.885 mln
jan 1, 1979
At the date of observation
Value
Absolute change
Change from previous value
jan 1, 1971
10.017 mln
+10.017 mln
0.0%
jan 1, 1972
8.675 mln
-1.342 mln
-13.4%
jan 1, 1973
108.0K
-8.567 mln
-98.76%
jan 1, 1974
113.0K
+5.0K
4.63%
jan 1, 1975
108.0K
-5.0K
-4.42%
jan 1, 1976
2.431 mln
+2.323 mln
2.15K%
jan 1, 1977
3.287 mln
+856.0K
35.21%
jan 1, 1979
35.885 mln
+32.598 mln
991.72%
jan 1, 1983
7.396 mln
-28.489 mln
-79.39%
jan 1, 2017
0.0
-7.396 mln
-100.0%
Ranking of countries by current statistics by years


Comments: