29
/
en
AIzaSyAYiBZKx7MnpbEhh9jyipgxe19OcubqV5w
April 1, 2024
125342
Egypt, Arab Rep.
EGY
true
2
1
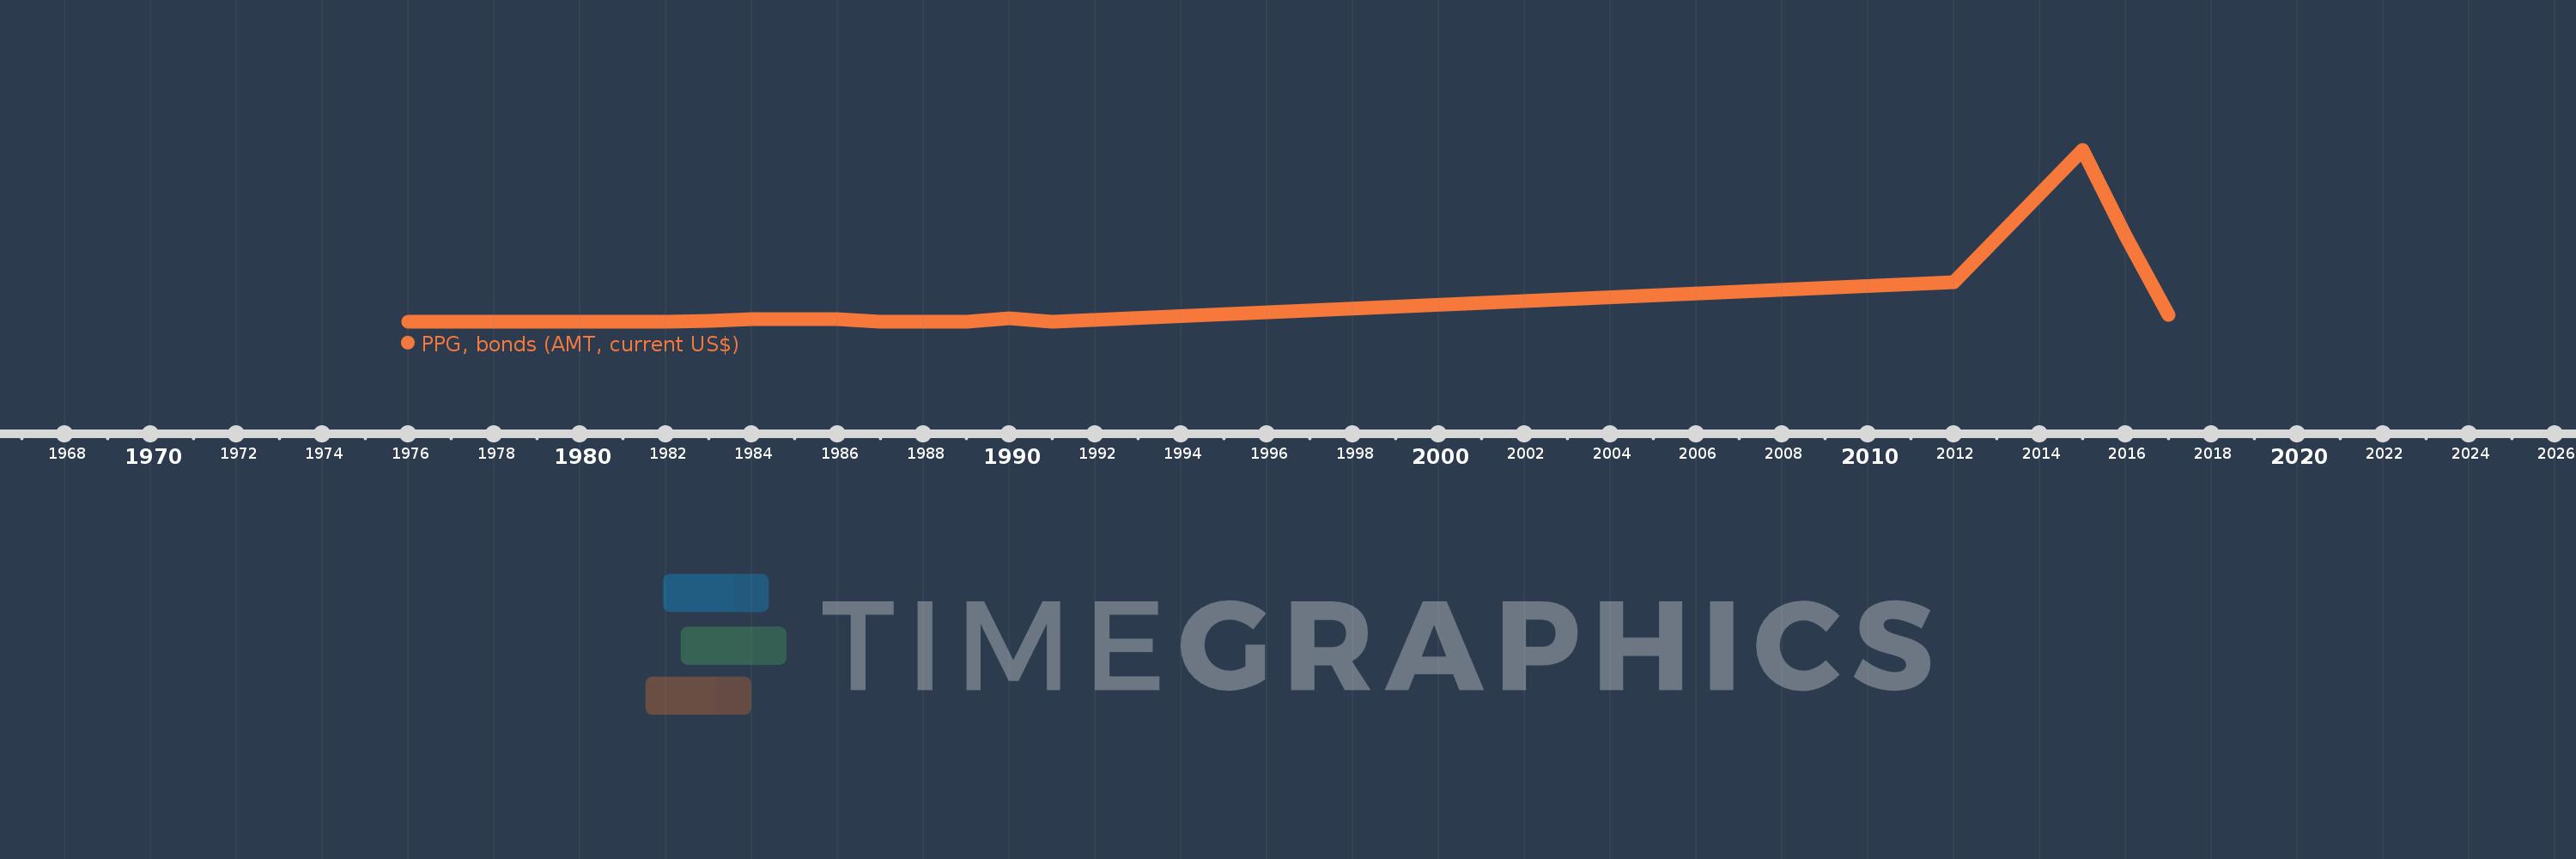
PPG, bonds (AMT, current US$)
2017,2016,2015,2012,1991,1990,1989,1988,1987,1986,1985,1984,1983,1982,1981,1980,1979,1978,1977,1976
This statistics in other country:
Timeline:
This timeline shows a graph from 1976 to 2017 of Egypt, Arab Rep.. No data until 1975. Number of actual observations by date: 20.
Source name:
World Development Indicators
Source organization:
World Bank, International Debt Statistics.
Categories, topics:
External Debt
Last updated:
apr 23, 2017
Indicators value changes by year
Minimum:
750.0K
jan 1, 1988
Maximum:
2.5 bln
jan 1, 2015
At the date of observation
Value
Absolute change
Change from previous value
jan 1, 1976
7.0 mln
+7.0 mln
0.0%
jan 1, 1977
7.0 mln
0.0
0.0%
jan 1, 1978
7.0 mln
0.0
0.0%
jan 1, 1979
7.0 mln
0.0
0.0%
jan 1, 1980
4.2 mln
-2.8 mln
-40.0%
jan 1, 1981
4.2 mln
0.0
0.0%
jan 1, 1982
9.2 mln
+5.0 mln
119.05%
jan 1, 1983
22.2 mln
+13.0 mln
141.3%
jan 1, 1984
40.834 mln
+18.634 mln
83.94%
jan 1, 1985
40.834 mln
0.0
0.0%
jan 1, 1986
40.234 mln
-600.0K
-1.47%
jan 1, 1987
6.0 mln
-34.234 mln
-85.09%
jan 1, 1988
750.0K
-5.25 mln
-87.5%
jan 1, 1989
750.0K
0.0
0.0%
jan 1, 1990
50.75 mln
+50.0 mln
6.67K%
jan 1, 1991
750.0K
-50.0 mln
-98.52%
jan 1, 2012
583.3 mln
+582.55 mln
77.67K%
jan 1, 2015
2.5 bln
+1.917 bln
328.6%
jan 1, 2016
1.25 bln
-1.25 bln
-50.0%
jan 1, 2017
100.0 mln
-1.15 bln
-92.0%
Ranking of countries by current statistics by years


Comments: