29
/
en
AIzaSyAYiBZKx7MnpbEhh9jyipgxe19OcubqV5w
April 1, 2024
230273
Russian Federation
RUS
true
2
1
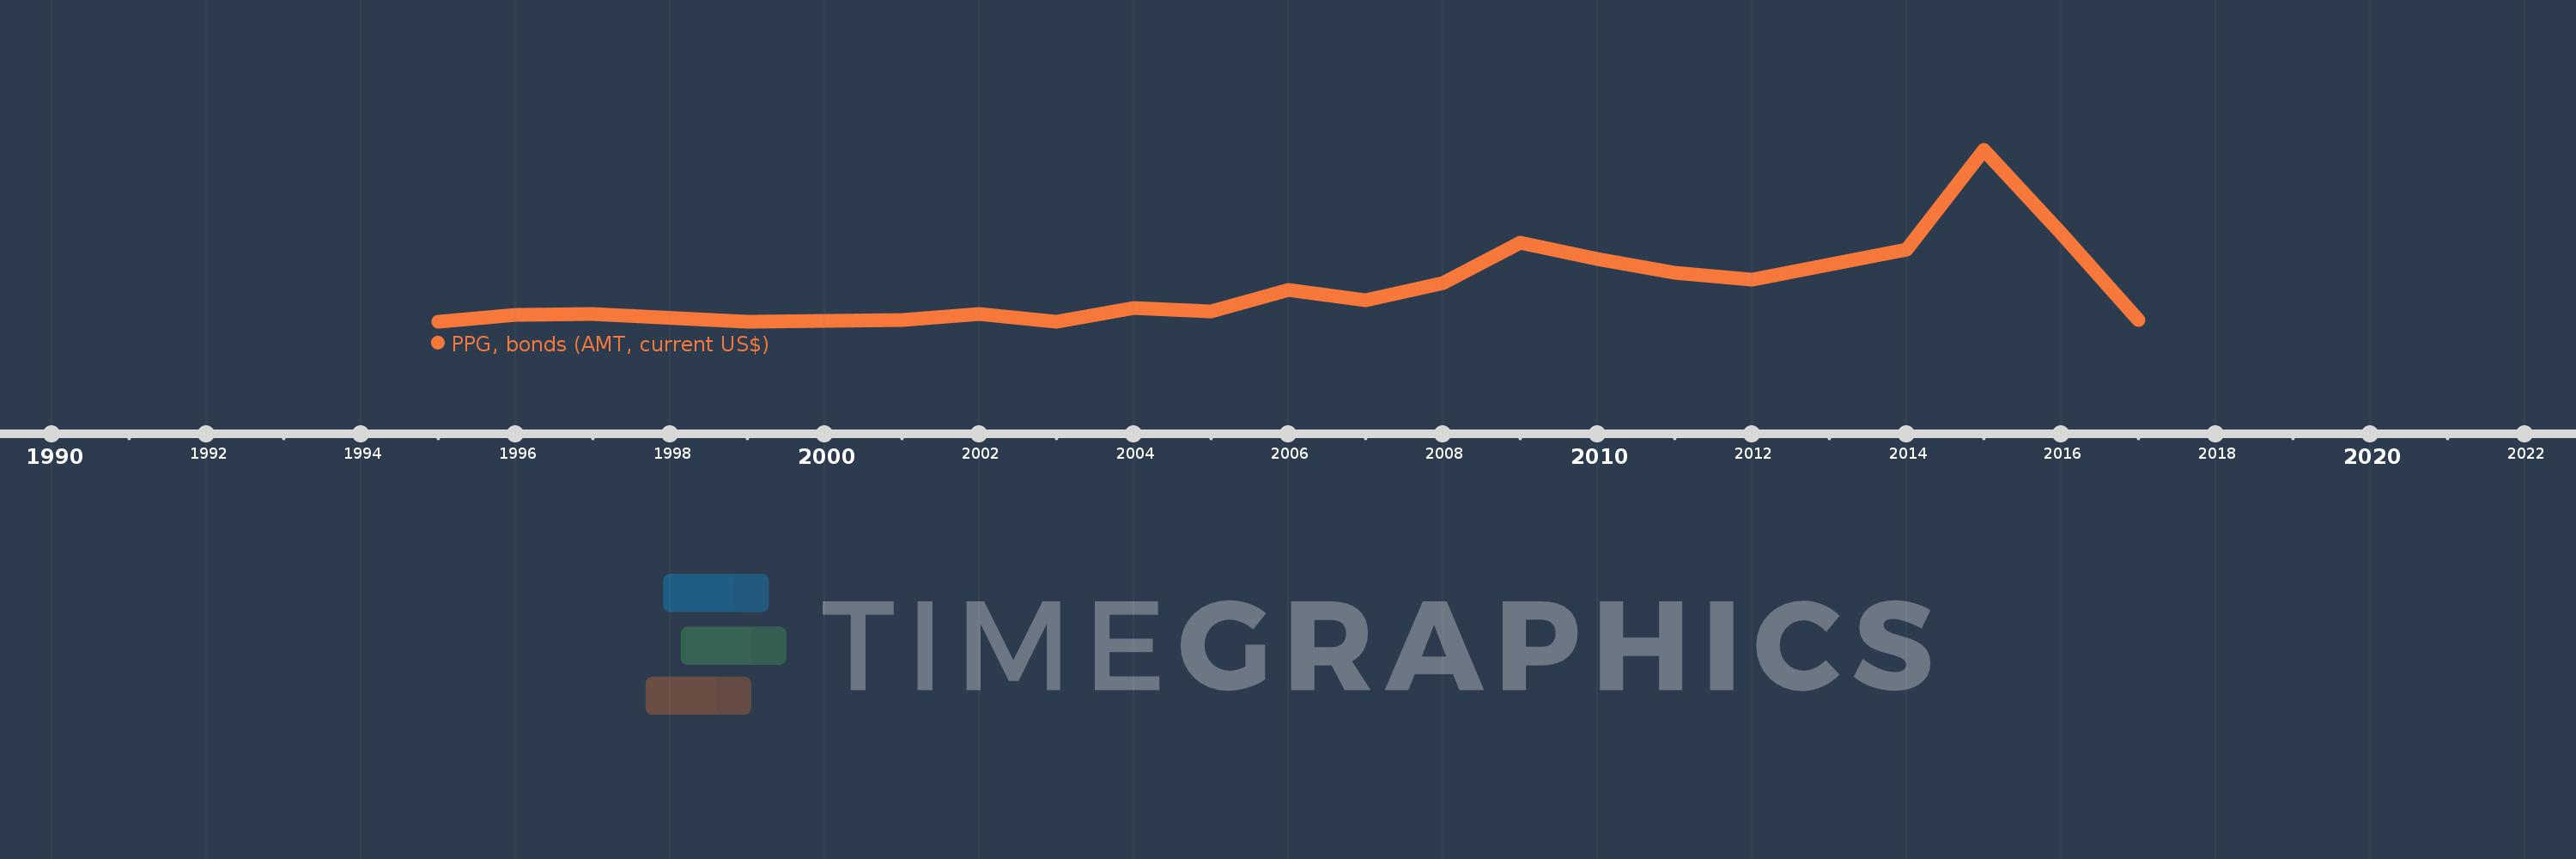
PPG, bonds (AMT, current US$)
2017,2016,2015,2014,2012,2011,2010,2009,2008,2007,2006,2005,2004,2003,2002,2001,1999,1997,1996,1995
This statistics in other country:
Timeline:
This timeline shows a graph from 1995 to 2017 of Russian Federation. No data until 1994. Number of actual observations by date: 20.
Source name:
World Development Indicators
Source organization:
World Bank, International Debt Statistics.
Categories, topics:
External Debt
Last updated:
apr 23, 2017
Indicators value changes by year
Minimum:
17.47 mln
jan 1, 2003
Maximum:
20.188 bln
jan 1, 2015
At the date of observation
Value
Absolute change
Change from previous value
jan 1, 1995
34.143 mln
+34.143 mln
0.0%
jan 1, 1996
810.149 mln
+776.006 mln
2.27K%
jan 1, 1997
979.341 mln
+169.192 mln
20.88%
jan 1, 1999
69.101 mln
-910.24 mln
-92.94%
jan 1, 2001
267.8 mln
+198.699 mln
287.55%
jan 1, 2002
1000.0 mln
+732.2 mln
273.41%
jan 1, 2003
17.47 mln
-982.53 mln
-98.25%
jan 1, 2004
1.688 bln
+1.671 bln
9.56K%
jan 1, 2005
1.271 bln
-416.635 mln
-24.68%
jan 1, 2006
3.765 bln
+2.493 bln
196.12%
jan 1, 2007
2.543 bln
-1.222 bln
-32.46%
jan 1, 2008
4.634 bln
+2.092 bln
82.26%
jan 1, 2009
9.365 bln
+4.731 bln
102.08%
jan 1, 2010
7.425 bln
-1.94 bln
-20.72%
jan 1, 2011
5.805 bln
-1.62 bln
-21.81%
jan 1, 2012
5.016 bln
-789.072 mln
-13.59%
jan 1, 2014
8.512 bln
+3.496 bln
69.7%
jan 1, 2015
20.188 bln
+11.676 bln
137.17%
jan 1, 2016
10.427 bln
-9.761 bln
-48.35%
jan 1, 2017
285.662 mln
-10.141 bln
-97.26%
Ranking of countries by current statistics by years


Comments: