29
/
en
AIzaSyAYiBZKx7MnpbEhh9jyipgxe19OcubqV5w
April 1, 2024
148424
Guyana
GUY
true
2
1
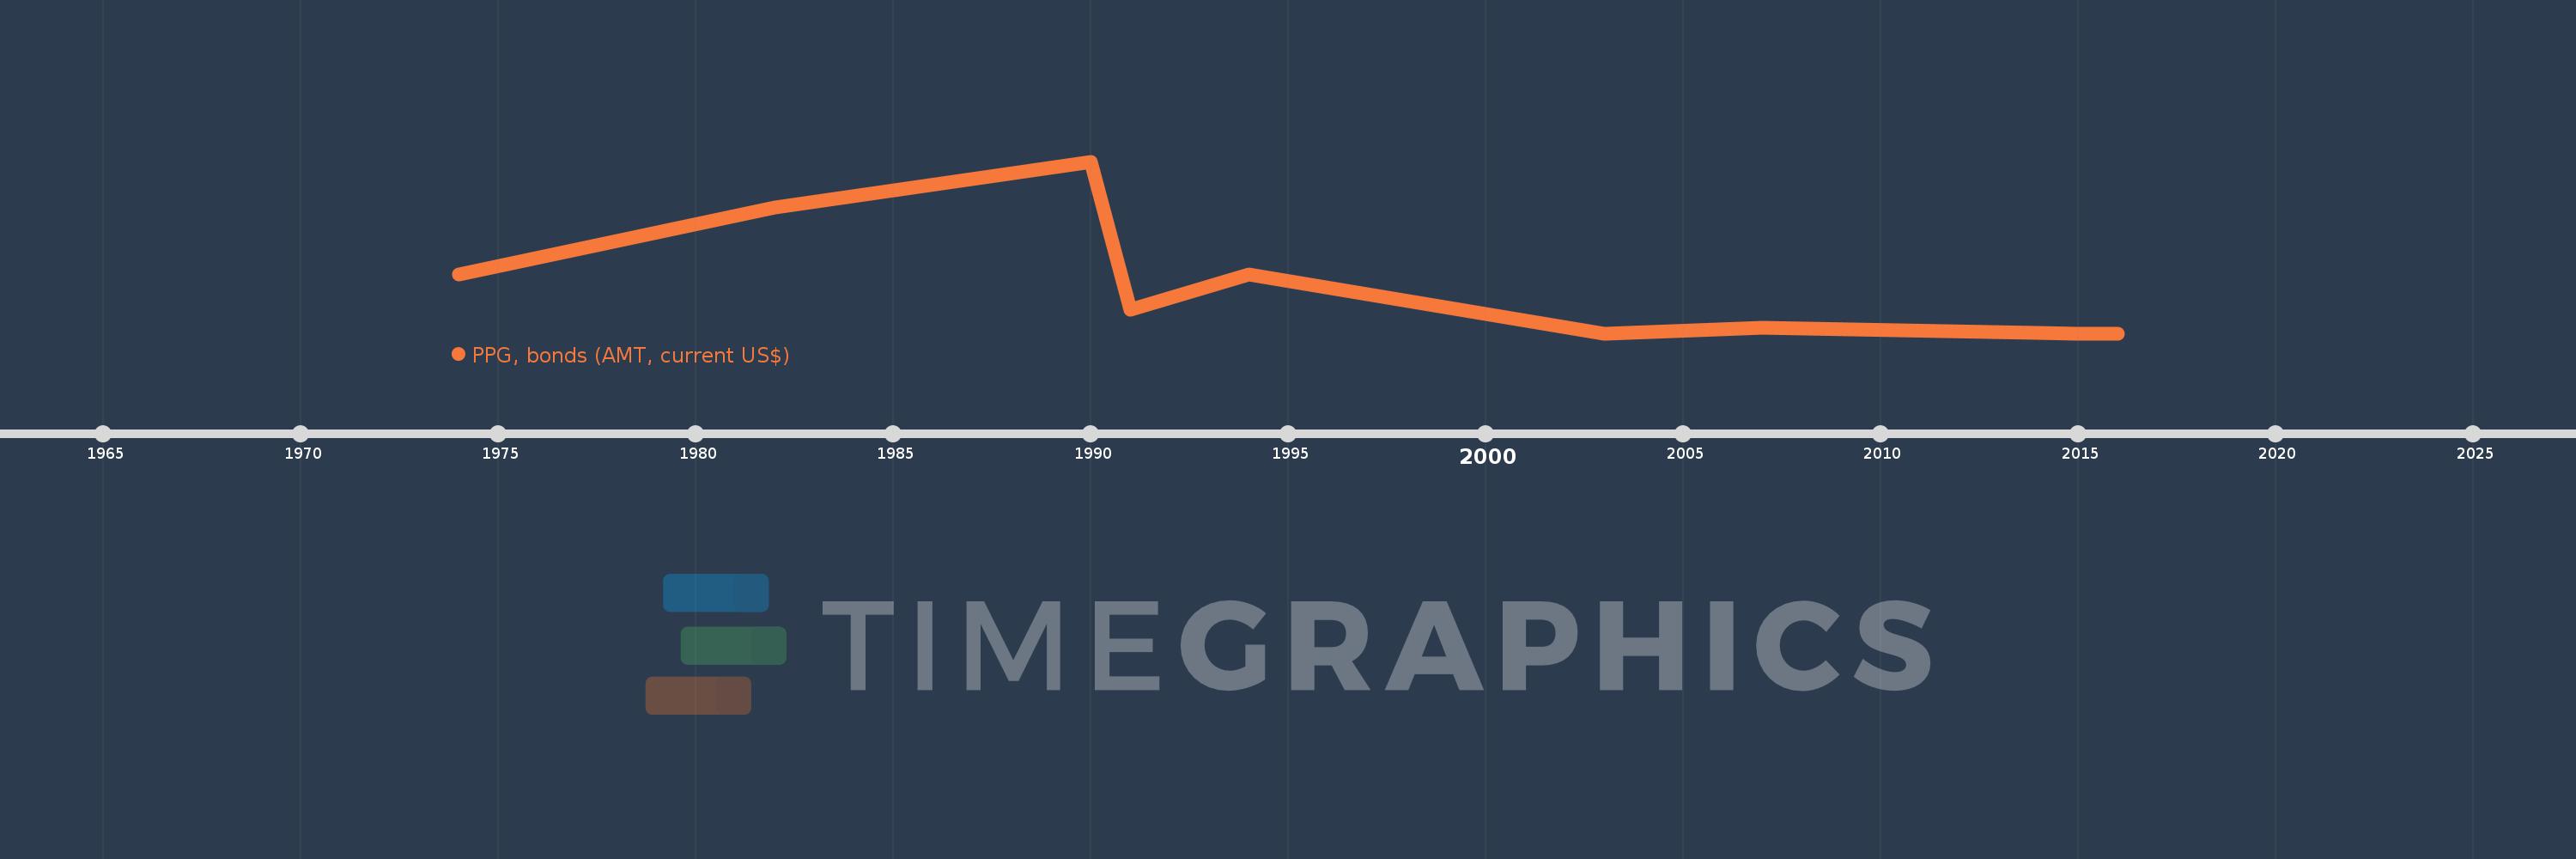
PPG, bonds (AMT, current US$)
2016,2015,2014,2007,2003,1994,1991,1990,1982,1974
This statistics in other country:
Timeline:
This timeline shows a graph from 1974 to 2016 of Guyana. No data until 1973. Number of actual observations by date: 10.
Source name:
World Development Indicators
Source organization:
World Bank, International Debt Statistics.
Categories, topics:
External Debt
Last updated:
apr 23, 2017
Indicators value changes by year
Maximum:
5.805 mln
jan 1, 1990
At the date of observation
Value
Absolute change
Change from previous value
jan 1, 1974
1.986 mln
+1.986 mln
0.0%
jan 1, 1982
4.238 mln
+2.252 mln
113.39%
jan 1, 1990
5.805 mln
+1.567 mln
36.97%
jan 1, 1991
785.0K
-5.02 mln
-86.48%
jan 1, 1994
2.0 mln
+1.215 mln
154.78%
jan 1, 2003
0.0
-2.0 mln
-100.0%
jan 1, 2007
201.0K
+201.0K
%
jan 1, 2014
12.0K
-189.0K
-94.03%
jan 1, 2015
0.0
-12.0K
-100.0%
Ranking of countries by current statistics by years


Comments: