29
/
en
AIzaSyAYiBZKx7MnpbEhh9jyipgxe19OcubqV5w
April 1, 2024
167017
Kazakhstan
KAZ
true
2
1
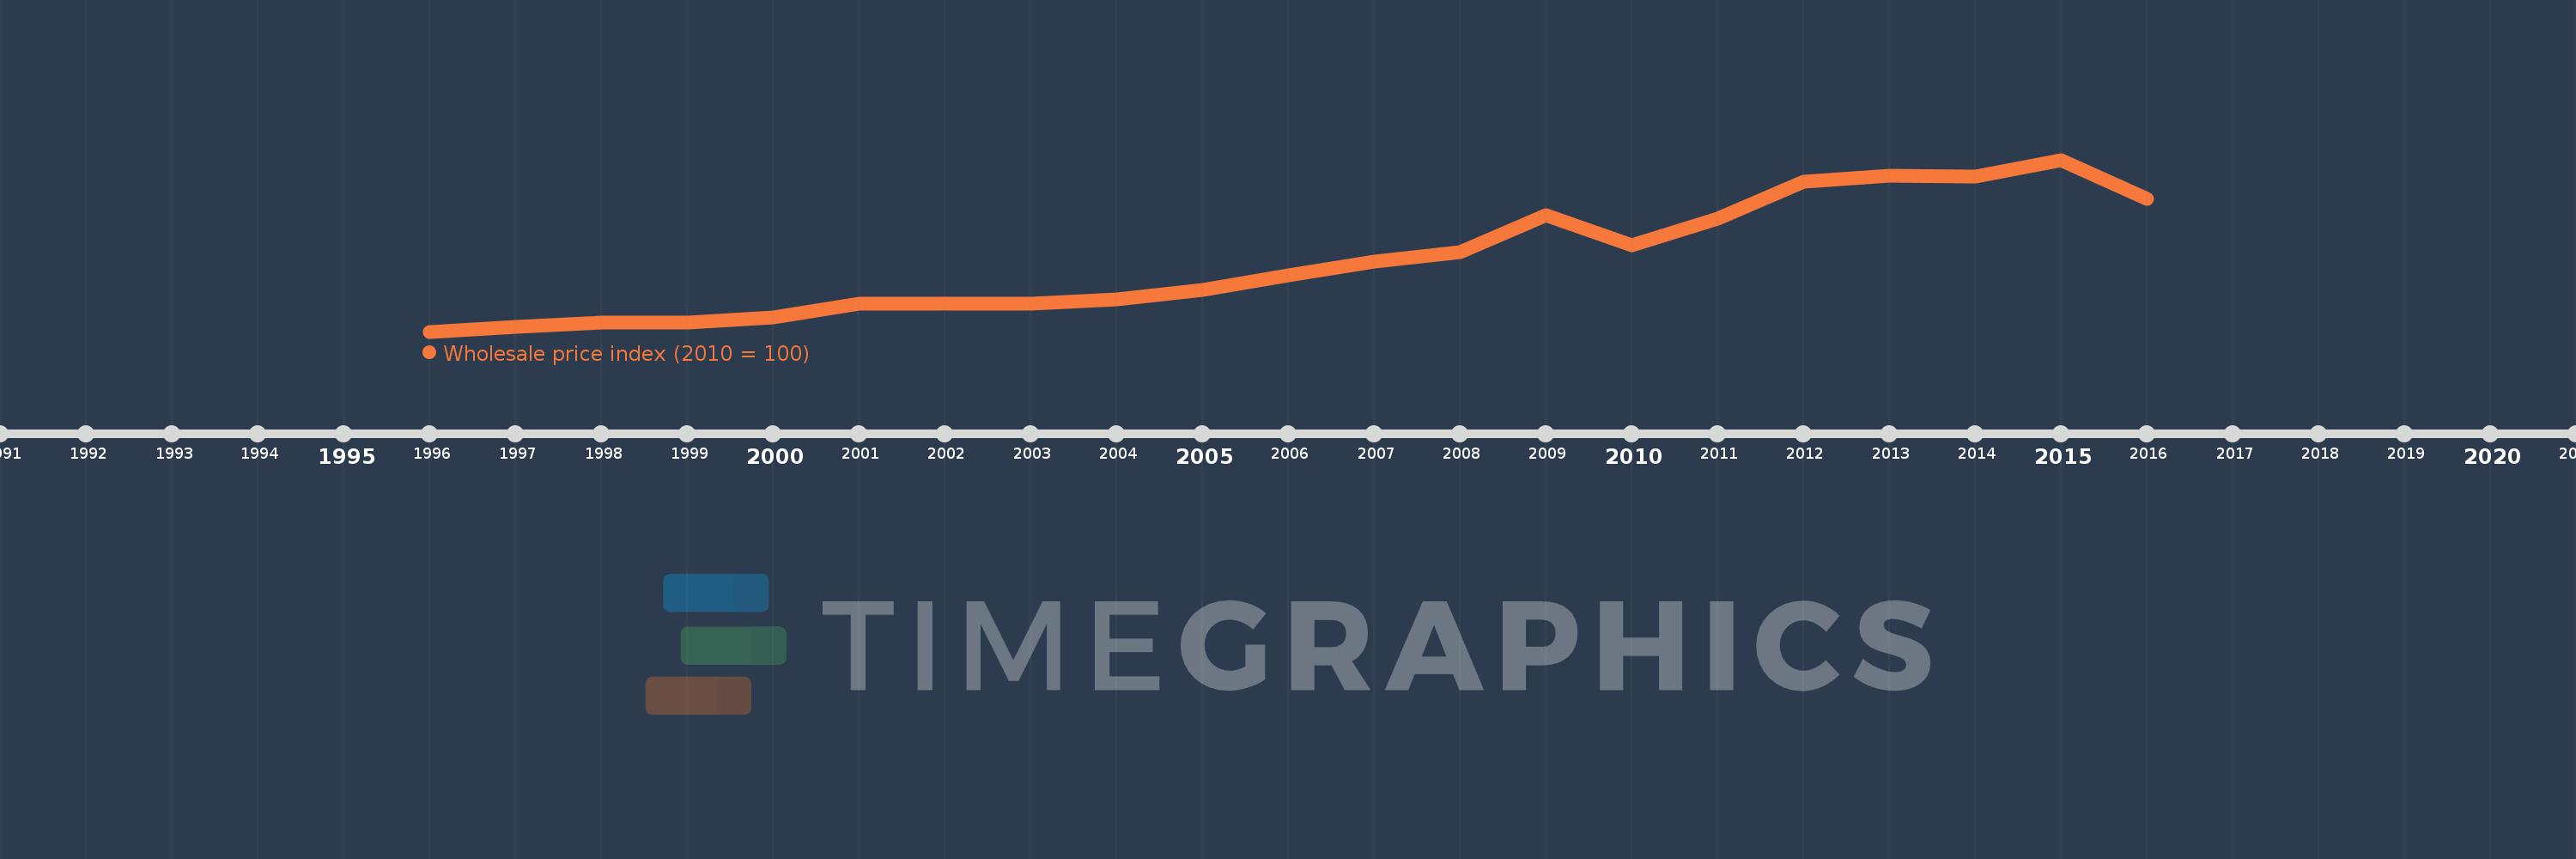
Wholesale price index (2010 = 100)
2016,2015,2014,2013,2012,2011,2010,2009,2008,2007,2006,2005,2004,2003,2002,2001,2000,1999,1998,1997,1996
This statistics in other country:
Timeline:
This timeline shows a graph from 1996 to 2016 of Kazakhstan. No data until 1995. Number of actual observations by date: 21.
Source name:
World Development Indicators
Source organization:
International Monetary Fund, International Financial Statistics and data files.
Categories, topics:
Financial Sector
Last updated:
apr 23, 2017
Indicators value changes by year
Minimum:
15.174
jan 1, 1996
Maximum:
143.711
jan 1, 2015
At the date of observation
Value
Absolute change
Change from previous value
jan 1, 1996
15.174
+15.174
0.0%
jan 1, 1997
18.802
+3.628
23.91%
jan 1, 1998
21.72
+2.918
15.52%
jan 1, 1999
21.901
+0.181
0.83%
jan 1, 2000
26.042
+4.141
18.91%
jan 1, 2001
35.932
+9.89
37.97%
jan 1, 2002
36.057
+0.125
0.35%
jan 1, 2003
36.116
+0.059
0.16%
jan 1, 2004
39.478
+3.362
9.31%
jan 1, 2005
46.09
+6.612
16.75%
jan 1, 2006
57.011
+10.921
23.7%
jan 1, 2007
67.532
+10.521
18.45%
jan 1, 2008
74.906
+7.374
10.92%
jan 1, 2009
102.498
+27.592
36.84%
jan 1, 2010
79.894
-22.603
-22.05%
jan 1, 2011
100.0
+20.106
25.17%
jan 1, 2012
127.226
+27.226
27.23%
jan 1, 2013
131.726
+4.499
3.54%
jan 1, 2014
131.278
-0.447
-0.34%
jan 1, 2015
143.711
+12.433
9.47%
jan 1, 2016
114.221
-29.491
-20.52%
Ranking of countries by current statistics by years


Comments: