29
/
en
AIzaSyAYiBZKx7MnpbEhh9jyipgxe19OcubqV5w
April 1, 2024
286747
Zambia
ZMB
true
2
1
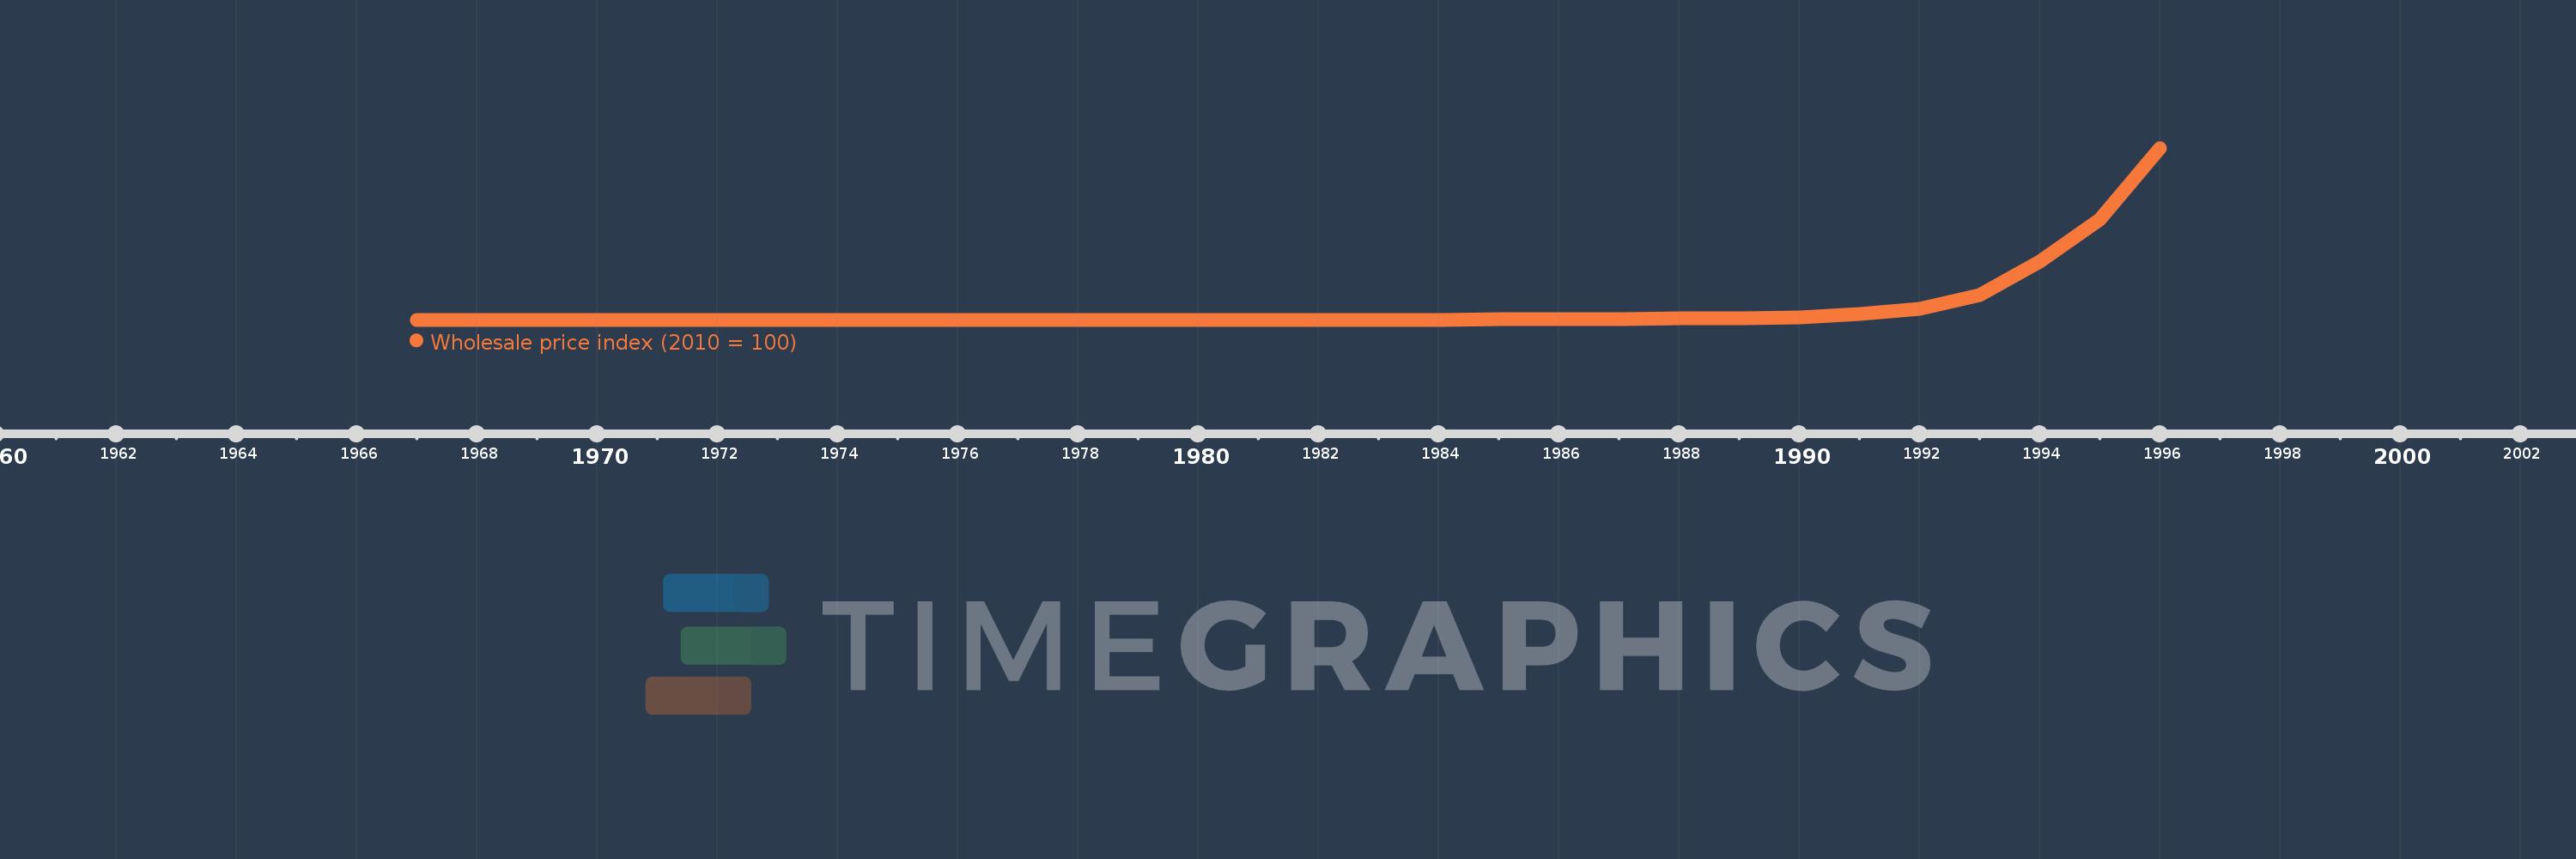
Wholesale price index (2010 = 100)
1996,1995,1994,1993,1992,1991,1990,1989,1988,1987,1986,1985,1984,1983,1982,1981,1980,1979,1978,1977,1976,1975,1974,1973,1972,1971,1970,1969,1968,1967
This statistics in other country:
Timeline:
This timeline shows a graph from 1967 to 1996 of Zambia. No data until 1966. Number of actual observations by date: 30.
Source name:
World Development Indicators
Source organization:
International Monetary Fund, International Financial Statistics and data files.
Categories, topics:
Financial Sector
Last updated:
apr 23, 2017
Indicators value changes by year
At the date of observation
Value
Absolute change
Change from previous value
jan 1, 1967
0.022
+0.022
0.0%
jan 1, 1968
0.021
0.0
-1.15%
jan 1, 1969
0.023
+0.002
8.73%
jan 1, 1970
0.025
+0.002
9.54%
jan 1, 1971
0.025
-0.001
-2.44%
jan 1, 1972
0.023
-0.002
-6.23%
jan 1, 1973
0.024
+0.001
5.11%
jan 1, 1974
0.03
+0.005
22.02%
jan 1, 1975
0.034
+0.004
12.83%
jan 1, 1976
0.031
-0.002
-6.66%
jan 1, 1977
0.037
+0.006
19.28%
jan 1, 1978
0.046
+0.008
21.96%
jan 1, 1979
0.053
+0.007
16.41%
jan 1, 1980
0.066
+0.013
24.3%
jan 1, 1981
0.075
+0.009
13.36%
jan 1, 1982
0.076
+0.001
1.43%
jan 1, 1983
0.081
+0.005
6.65%
jan 1, 1984
0.1
+0.02
24.1%
jan 1, 1985
0.128
+0.028
27.93%
jan 1, 1986
0.189
+0.061
47.21%
jan 1, 1987
0.408
+0.219
115.92%
jan 1, 1988
0.753
+0.345
84.41%
jan 1, 1989
0.84
+0.087
11.56%
jan 1, 1990
1.547
+0.707
84.2%
jan 1, 1991
3.335
+1.788
115.58%
jan 1, 1992
6.394
+3.059
91.71%
jan 1, 1993
14.149
+7.755
121.28%
jan 1, 1994
34.074
+19.925
140.82%
jan 1, 1995
58.13
+24.057
70.6%
jan 1, 1996
100.0
+41.87
72.03%
Ranking of countries by current statistics by years


Comments: