29
/
en
AIzaSyAYiBZKx7MnpbEhh9jyipgxe19OcubqV5w
April 1, 2024
70677
Argentina
ARG
true
2
1
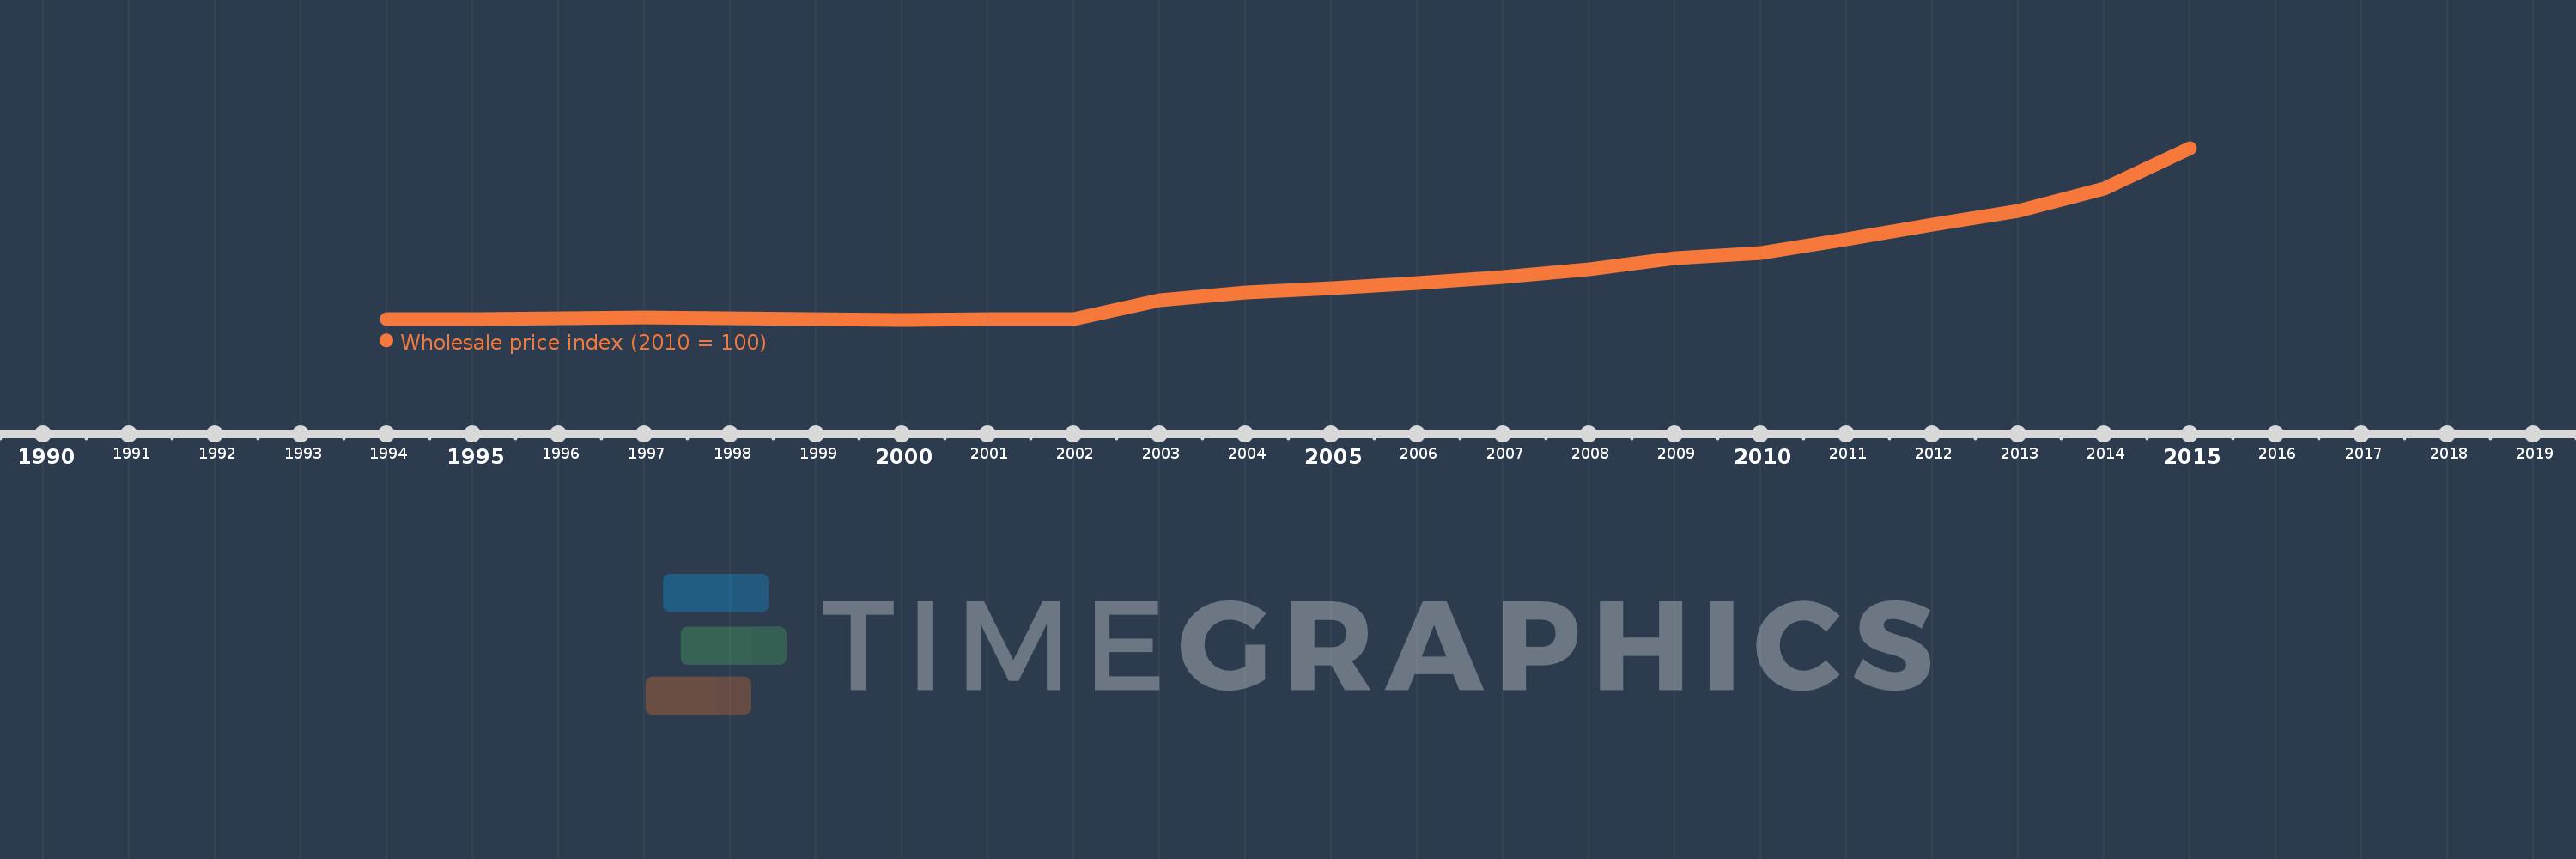
Wholesale price index (2010 = 100)
2015,2014,2013,2012,2011,2010,2009,2008,2007,2006,2005,2004,2003,2002,2001,2000,1999,1998,1997,1996,1995,1994
This statistics in other country:
Timeline:
This timeline shows a graph from 1994 to 2015 of Argentina. No data until 1993. Number of actual observations by date: 22.
Source name:
World Development Indicators
Source organization:
International Monetary Fund, International Financial Statistics and data files.
Categories, topics:
Financial Sector
Last updated:
apr 23, 2017
Indicators value changes by year
Minimum:
22.754
jan 1, 2000
Maximum:
187.771
jan 1, 2015
At the date of observation
Value
Absolute change
Change from previous value
jan 1, 1994
23.0
+23.0
0.0%
jan 1, 1995
23.089
+0.09
0.39%
jan 1, 1996
24.085
+0.996
4.31%
jan 1, 1997
24.795
+0.71
2.95%
jan 1, 1998
24.492
-0.303
-1.22%
jan 1, 1999
23.709
-0.784
-3.2%
jan 1, 2000
22.754
-0.955
-4.03%
jan 1, 2001
23.593
+0.839
3.69%
jan 1, 2002
23.112
-0.481
-2.04%
jan 1, 2003
41.199
+18.087
78.26%
jan 1, 2004
49.28
+8.08
19.61%
jan 1, 2005
53.079
+3.8
7.71%
jan 1, 2006
57.591
+4.512
8.5%
jan 1, 2007
63.887
+6.295
10.93%
jan 1, 2008
71.425
+7.538
11.8%
jan 1, 2009
81.765
+10.34
14.48%
jan 1, 2010
86.902
+5.137
6.28%
jan 1, 2011
100.0
+13.098
15.07%
jan 1, 2012
113.751
+13.751
13.75%
jan 1, 2013
127.618
+13.867
12.19%
jan 1, 2014
148.452
+20.834
16.33%
jan 1, 2015
187.771
+39.32
26.49%
Ranking of countries by current statistics by years


Comments: