29
/
en
AIzaSyAYiBZKx7MnpbEhh9jyipgxe19OcubqV5w
April 1, 2024
274460
Ukraine
UKR
true
2
1
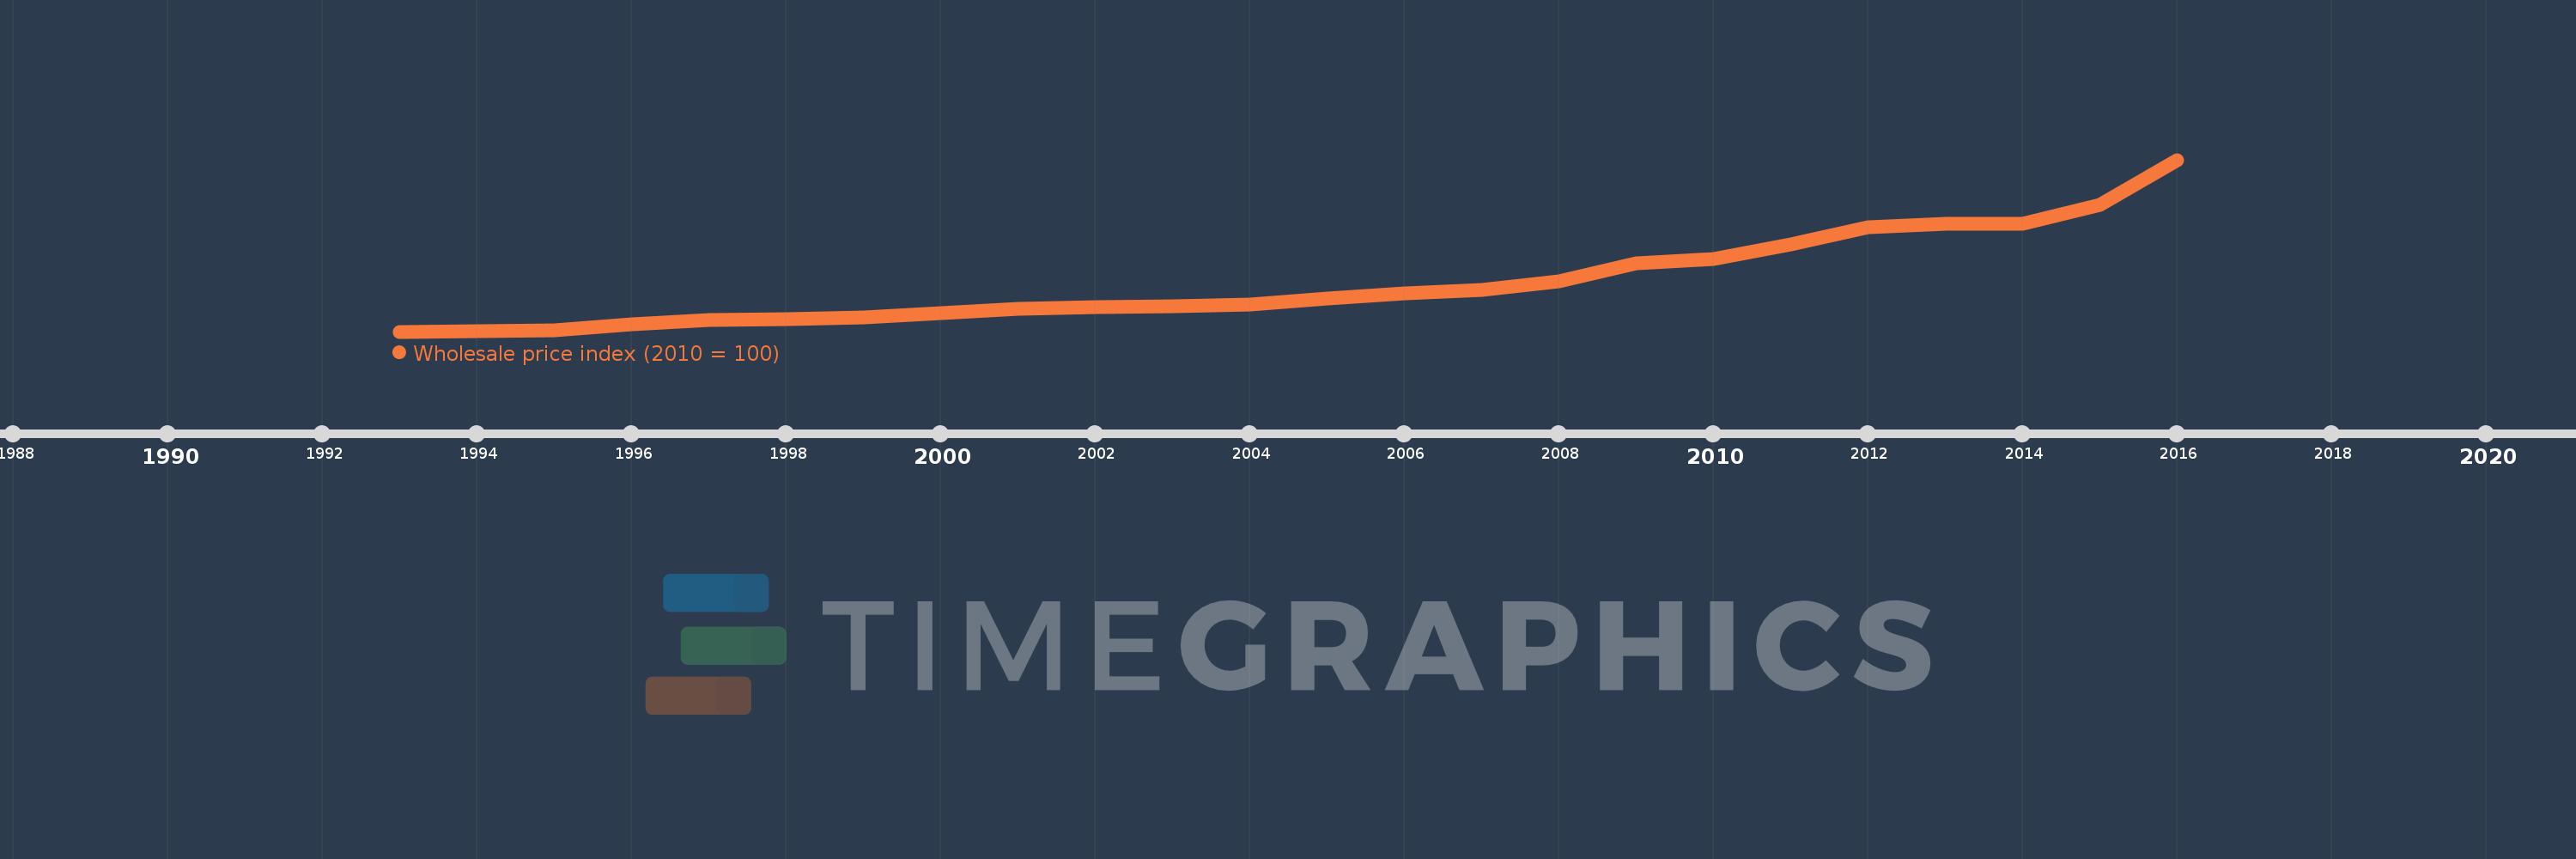
Wholesale price index (2010 = 100)
2016,2015,2014,2013,2012,2011,2010,2009,2008,2007,2006,2005,2004,2003,2002,2001,2000,1999,1998,1997,1996,1995,1994,1993
This statistics in other country:
Timeline:
This timeline shows a graph from 1993 to 2016 of Ukraine. No data until 1992. Number of actual observations by date: 24.
Source name:
World Development Indicators
Source organization:
International Monetary Fund, International Financial Statistics and data files.
Categories, topics:
Financial Sector
Last updated:
apr 23, 2017
Indicators value changes by year
Maximum:
196.448
jan 1, 2016
At the date of observation
Value
Absolute change
Change from previous value
jan 1, 1993
0.003
+0.003
0.0%
jan 1, 1994
0.12
+0.118
4.62K%
jan 1, 1995
1.498
+1.378
1.14K%
jan 1, 1996
8.808
+7.31
487.94%
jan 1, 1997
13.376
+4.568
51.86%
jan 1, 1998
14.399
+1.023
7.65%
jan 1, 1999
16.301
+1.902
13.21%
jan 1, 2000
21.375
+5.073
31.12%
jan 1, 2001
25.833
+4.458
20.86%
jan 1, 2002
28.068
+2.234
8.65%
jan 1, 2003
28.929
+0.861
3.07%
jan 1, 2004
31.089
+2.161
7.47%
jan 1, 2005
37.459
+6.369
20.49%
jan 1, 2006
43.744
+6.285
16.78%
jan 1, 2007
47.925
+4.181
9.56%
jan 1, 2008
57.268
+9.344
19.5%
jan 1, 2009
77.611
+20.343
35.52%
jan 1, 2010
82.73
+5.119
6.6%
jan 1, 2011
100.0
+17.27
20.88%
jan 1, 2012
119.059
+19.059
19.06%
jan 1, 2013
123.461
+4.402
3.7%
jan 1, 2014
123.361
-0.1
-0.08%
jan 1, 2015
144.472
+21.11
17.11%
jan 1, 2016
196.448
+51.976
35.98%
Ranking of countries by current statistics by years


Comments: