29
/
en
AIzaSyAYiBZKx7MnpbEhh9jyipgxe19OcubqV5w
April 1, 2024
145711
Guinea
GIN
true
2
1
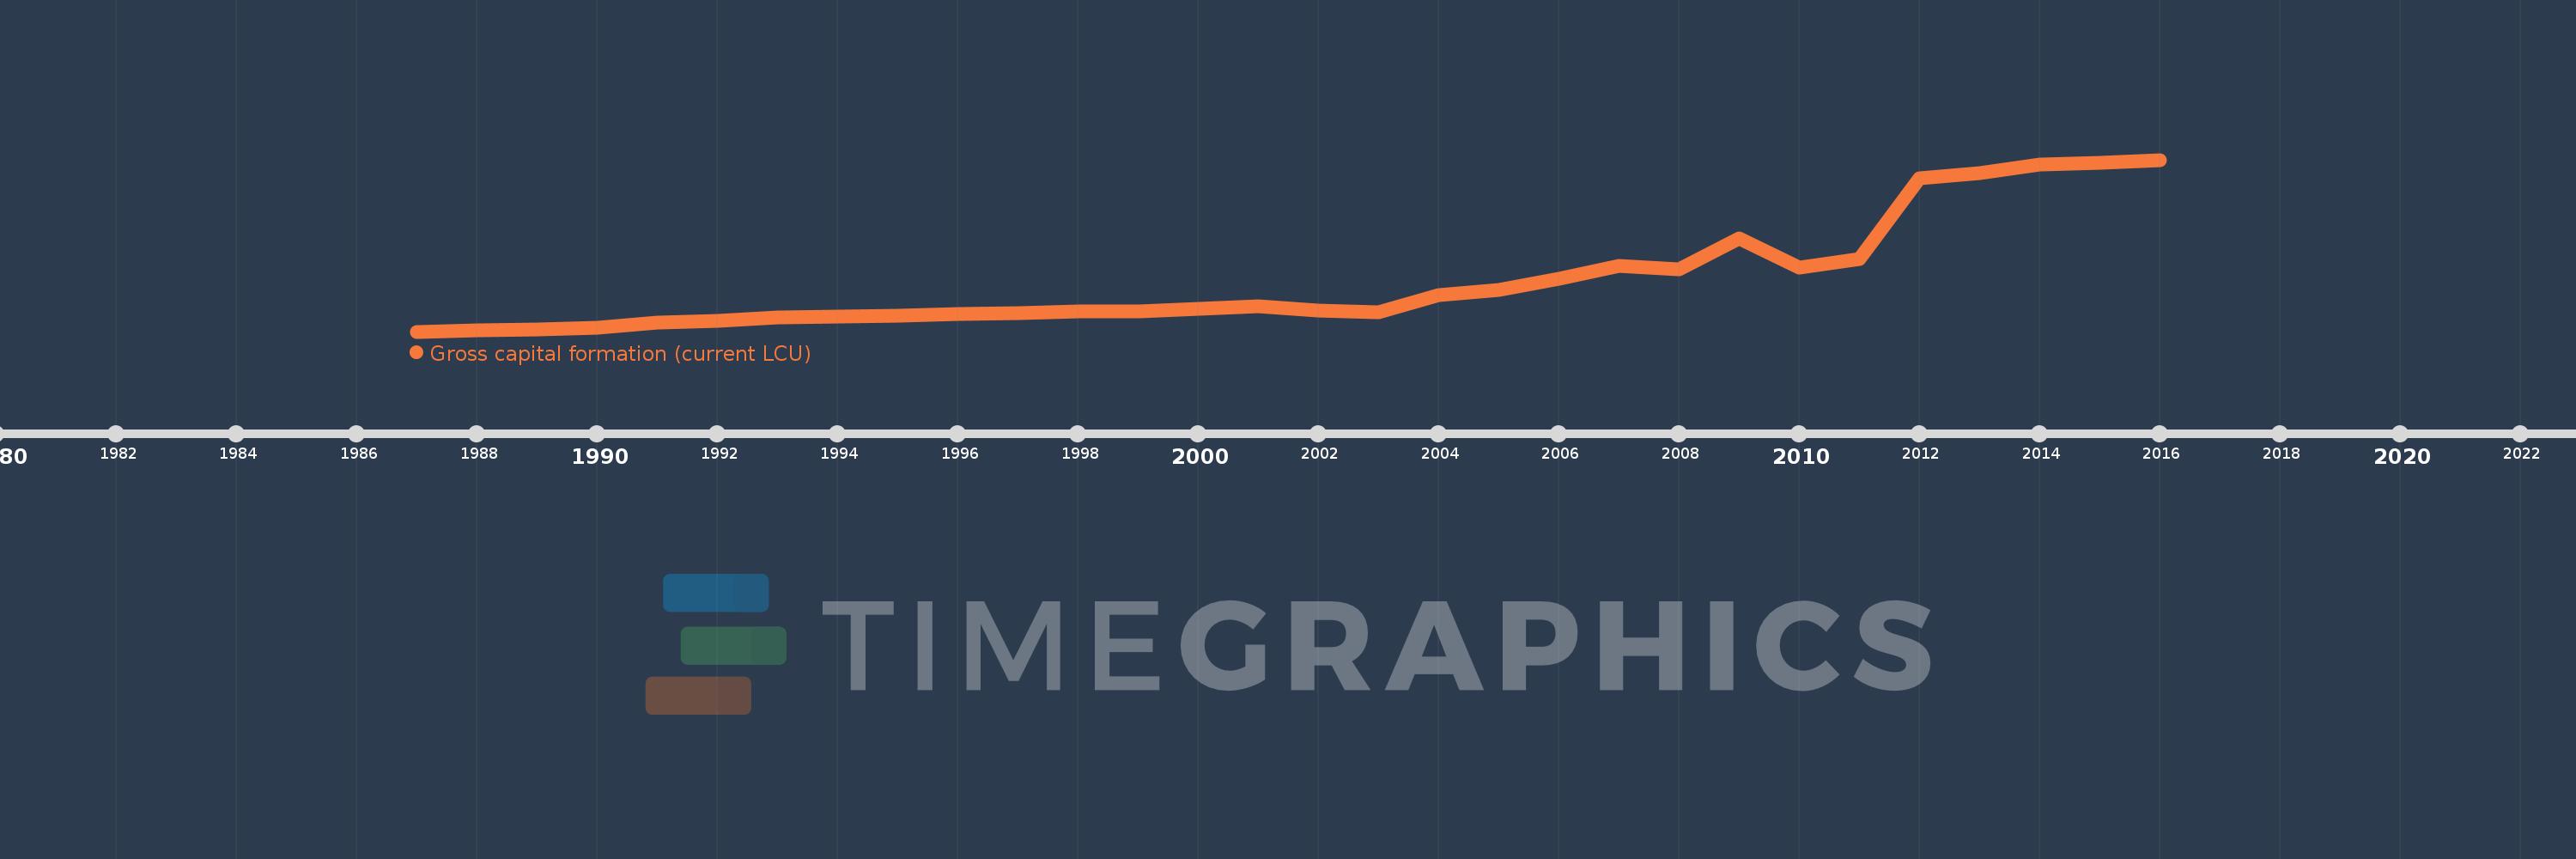
Gross capital formation (current LCU)
2016,2015,2014,2013,2012,2011,2010,2009,2008,2007,2006,2005,2004,2003,2002,2001,2000,1999,1998,1997,1996,1995,1994,1993,1992,1991,1990,1989,1988,1987
This statistics in other country:
AfghanistanAlbaniaAlgeriaAngolaAntigua and BarbudaArgentinaArmeniaArubaAustraliaAustriaAzerbaijanBahamas, TheBahrainBangladeshBarbadosBelarusBelgiumBelizeBeninBermudaBhutanBoliviaBosnia and HerzegovinaBotswanaBrazilBrunei DarussalamBulgariaBurkina FasoBurundiCabo VerdeCambodiaCameroonCanadaCentral African RepublicChadChileChinaColombiaComorosCongo, Dem. Rep.Congo, Rep.Costa RicaCote d'IvoireCroatiaCubaCyprusCzech RepublicDenmarkDjiboutiDominicaDominican RepublicEcuadorEgypt, Arab Rep.El SalvadorEquatorial GuineaEritreaEstoniaEthiopiaFaroe IslandsFijiFinlandFranceGabonGambia, TheGeorgiaGermanyGhanaGreeceGrenadaGuatemalaGuineaGuinea-BissauGuyanaHaitiHondurasHong Kong SAR, ChinaHungaryIcelandIndiaIndonesiaIran, Islamic Rep.IraqIrelandIsraelItalyJamaicaJapanJordanKazakhstanKenyaKiribatiKorea, Rep.KosovoKuwaitKyrgyz RepublicLao PDRLatviaLebanonLesothoLiberiaLibyaLithuaniaLuxembourgMacao SAR, ChinaMacedonia, FYRMadagascarMalawiMalaysiaMaldivesMaliMaltaMauritaniaMauritiusMexicoMicronesia, Fed. Sts.MoldovaMongoliaMontenegroMoroccoMozambiqueNamibiaNepalNetherlandsNew CaledoniaNew ZealandNicaraguaNigerNigeriaNorwayOmanPakistanPanamaPapua New GuineaParaguayPeruPhilippinesPolandPortugalPuerto RicoQatarRomaniaRussian FederationRwandaSaudi ArabiaSenegalSerbiaSeychellesSierra LeoneSingaporeSlovak RepublicSloveniaSolomon IslandsSomaliaSouth AfricaSouth SudanSpainSri LankaSt. Kitts and NevisSt. LuciaSt. Vincent and the GrenadinesSudanSurinameSwazilandSwedenSwitzerlandSyrian Arab RepublicTajikistanTanzaniaThailandTimor-LesteTogoTongaTrinidad and TobagoTunisiaTurkeyTurkmenistanUgandaUkraineUnited Arab EmiratesUnited KingdomUnited StatesUruguayUzbekistanVanuatuVenezuela, RBVietnamWest Bank and GazaYemen, Rep.ZambiaZimbabwe Timeline:
This timeline shows a graph from 1987 to 2016 of Guinea. No data until 1986. Number of actual observations by date: 30.
Source name:
World Development Indicators
Source organization:
World Bank national accounts data, and OECD National Accounts data files.
Categories, topics:
Economy & Growth
Last updated:
apr 23, 2017
Indicators value changes by year
Minimum:
99.329 bln
jan 1, 1987
Maximum:
6.623 trl
jan 1, 2016
At the date of observation
Value
Absolute change
Change from previous value
jan 1, 1987
99.329 bln
+99.329 bln
0.0%
jan 1, 1988
142.197 bln
+42.867 bln
43.16%
jan 1, 1989
193.275 bln
+51.078 bln
35.92%
jan 1, 1990
247.245 bln
+53.97 bln
27.92%
jan 1, 1991
431.777 bln
+184.532 bln
74.64%
jan 1, 1992
508.775 bln
+76.998 bln
17.83%
jan 1, 1993
628.701 bln
+119.926 bln
23.57%
jan 1, 1994
679.775 bln
+51.075 bln
8.12%
jan 1, 1995
693.616 bln
+13.841 bln
2.04%
jan 1, 1996
783.432 bln
+89.816 bln
12.95%
jan 1, 1997
807.298 bln
+23.866 bln
3.05%
jan 1, 1998
870.681 bln
+63.383 bln
7.85%
jan 1, 1999
852.503 bln
-18.179 bln
-2.09%
jan 1, 2000
953.109 bln
+100.606 bln
11.8%
jan 1, 2001
1.071 trl
+118.131 bln
12.39%
jan 1, 2002
909.373 bln
-161.867 bln
-15.11%
jan 1, 2003
847.457 bln
-61.916 bln
-6.81%
jan 1, 2004
1.479 trl
+631.33 bln
74.5%
jan 1, 2005
1.691 trl
+212.084 bln
14.34%
jan 1, 2006
2.091 trl
+400.073 bln
23.66%
jan 1, 2007
2.601 trl
+509.744 bln
24.38%
jan 1, 2008
2.472 trl
-128.925 bln
-4.96%
jan 1, 2009
3.64 trl
+1.168 trl
47.25%
jan 1, 2010
2.53 trl
-1.11 trl
-30.48%
jan 1, 2011
2.865 trl
+335.331 bln
13.25%
jan 1, 2012
5.938 trl
+3.073 trl
107.23%
jan 1, 2013
6.111 trl
+173.014 bln
2.91%
jan 1, 2014
6.443 trl
+332.3 bln
5.44%
jan 1, 2015
6.512 trl
+68.919 bln
1.07%
jan 1, 2016
6.623 trl
+110.781 bln
1.7%
Ranking of countries by current statistics by years


Comments: