29
/
en
AIzaSyAYiBZKx7MnpbEhh9jyipgxe19OcubqV5w
April 1, 2024
183910
Macedonia, FYR
MKD
true
2
1
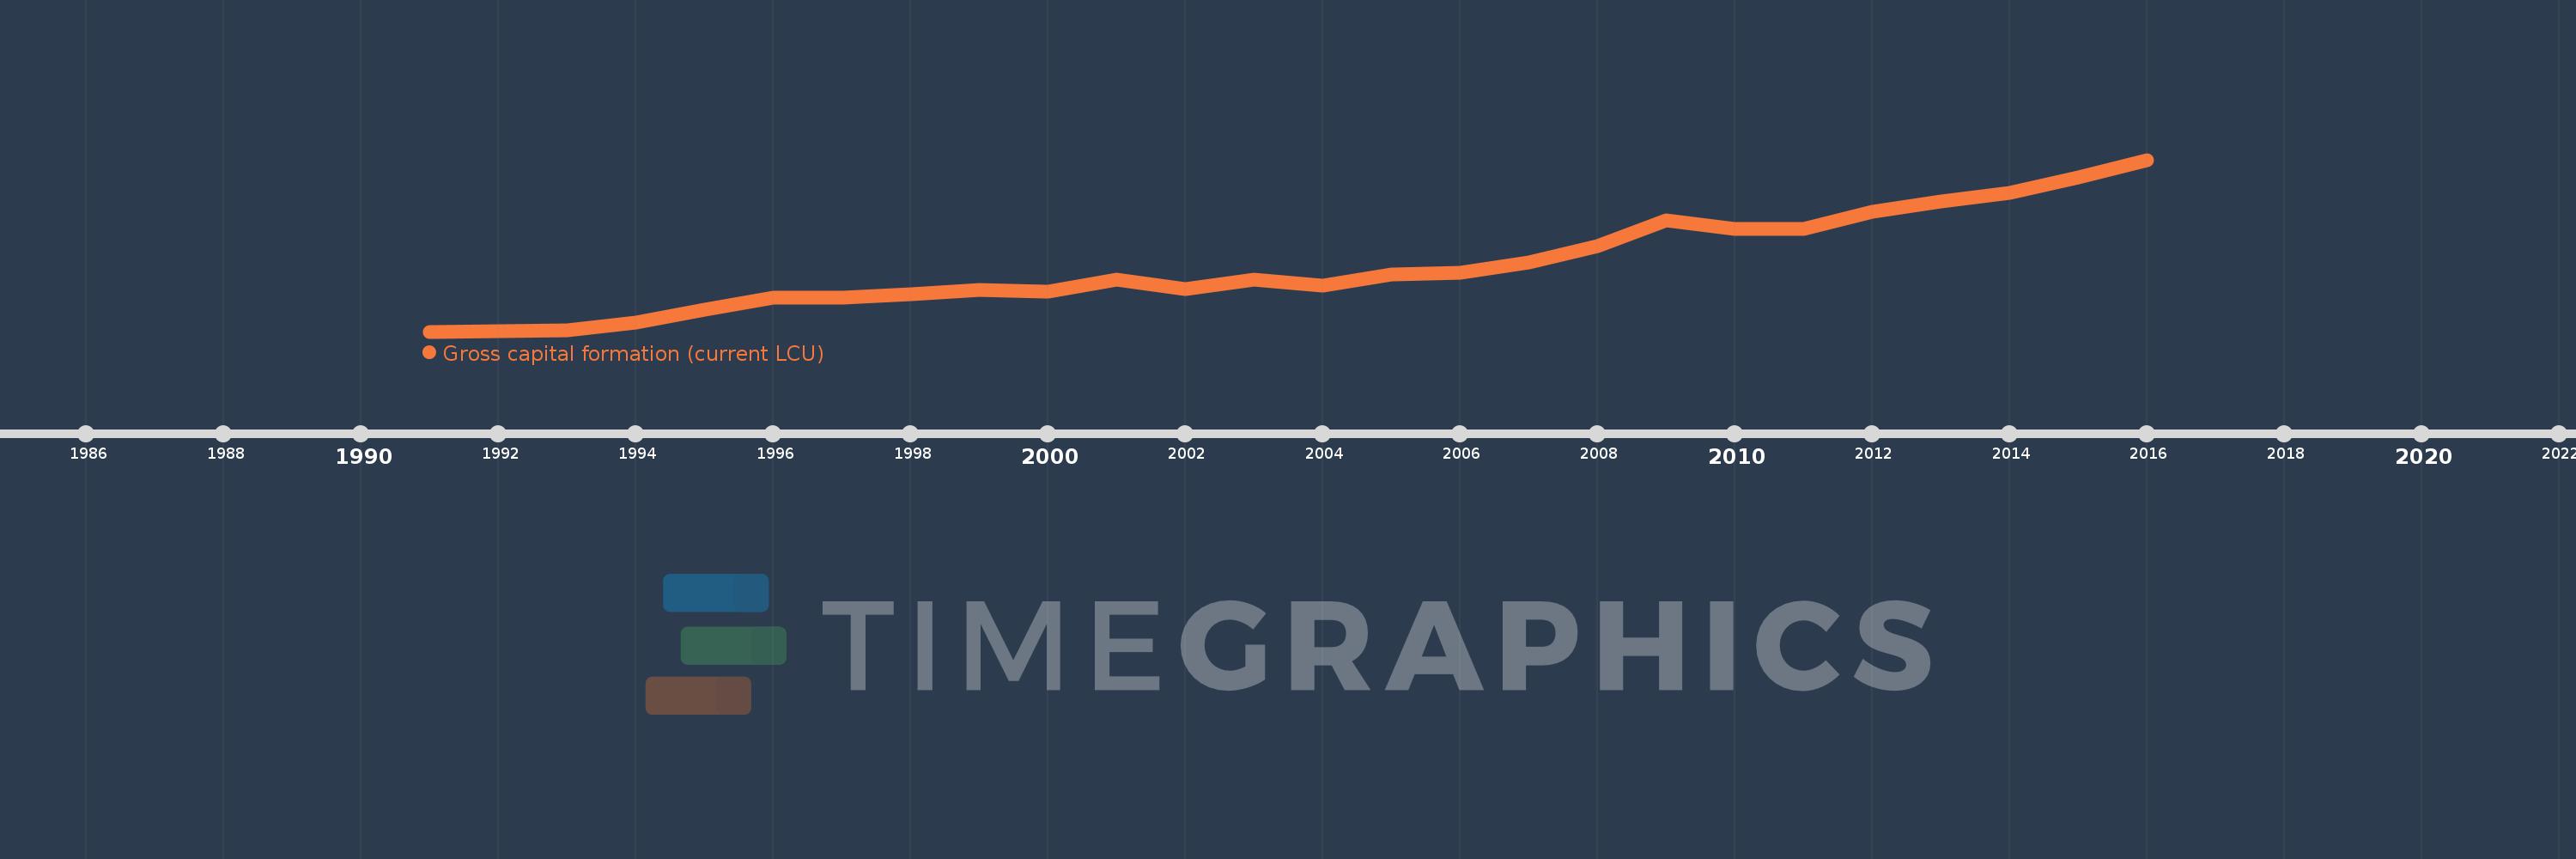
Gross capital formation (current LCU)
2016,2015,2014,2013,2012,2011,2010,2009,2008,2007,2006,2005,2004,2003,2002,2001,2000,1999,1998,1997,1996,1995,1994,1993,1992,1991
This statistics in other country:
AfghanistanAlbaniaAlgeriaAngolaAntigua and BarbudaArgentinaArmeniaArubaAustraliaAustriaAzerbaijanBahamas, TheBahrainBangladeshBarbadosBelarusBelgiumBelizeBeninBermudaBhutanBoliviaBosnia and HerzegovinaBotswanaBrazilBrunei DarussalamBulgariaBurkina FasoBurundiCabo VerdeCambodiaCameroonCanadaCentral African RepublicChadChileChinaColombiaComorosCongo, Dem. Rep.Congo, Rep.Costa RicaCote d'IvoireCroatiaCubaCyprusCzech RepublicDenmarkDjiboutiDominicaDominican RepublicEcuadorEgypt, Arab Rep.El SalvadorEquatorial GuineaEritreaEstoniaEthiopiaFaroe IslandsFijiFinlandFranceGabonGambia, TheGeorgiaGermanyGhanaGreeceGrenadaGuatemalaGuineaGuinea-BissauGuyanaHaitiHondurasHong Kong SAR, ChinaHungaryIcelandIndiaIndonesiaIran, Islamic Rep.IraqIrelandIsraelItalyJamaicaJapanJordanKazakhstanKenyaKiribatiKorea, Rep.KosovoKuwaitKyrgyz RepublicLao PDRLatviaLebanonLesothoLiberiaLibyaLithuaniaLuxembourgMacao SAR, ChinaMacedonia, FYRMadagascarMalawiMalaysiaMaldivesMaliMaltaMauritaniaMauritiusMexicoMicronesia, Fed. Sts.MoldovaMongoliaMontenegroMoroccoMozambiqueNamibiaNepalNetherlandsNew CaledoniaNew ZealandNicaraguaNigerNigeriaNorwayOmanPakistanPanamaPapua New GuineaParaguayPeruPhilippinesPolandPortugalPuerto RicoQatarRomaniaRussian FederationRwandaSaudi ArabiaSenegalSerbiaSeychellesSierra LeoneSingaporeSlovak RepublicSloveniaSolomon IslandsSomaliaSouth AfricaSouth SudanSpainSri LankaSt. Kitts and NevisSt. LuciaSt. Vincent and the GrenadinesSudanSurinameSwazilandSwedenSwitzerlandSyrian Arab RepublicTajikistanTanzaniaThailandTimor-LesteTogoTongaTrinidad and TobagoTunisiaTurkeyTurkmenistanUgandaUkraineUnited Arab EmiratesUnited KingdomUnited StatesUruguayUzbekistanVanuatuVenezuela, RBVietnamWest Bank and GazaYemen, Rep.ZambiaZimbabwe Timeline:
This timeline shows a graph from 1991 to 2016 of Macedonia, FYR. No data until 1990. Number of actual observations by date: 26.
Source name:
World Development Indicators
Source organization:
World Bank national accounts data, and OECD National Accounts data files.
Categories, topics:
Economy & Growth
Last updated:
apr 23, 2017
Indicators value changes by year
Minimum:
94.5 mln
jan 1, 1991
Maximum:
178.492 bln
jan 1, 2016
At the date of observation
Value
Absolute change
Change from previous value
jan 1, 1991
94.5 mln
+94.5 mln
0.0%
jan 1, 1992
162.7 mln
+68.2 mln
72.17%
jan 1, 1993
1.826 bln
+1.664 bln
1.02K%
jan 1, 1994
9.462 bln
+7.636 bln
418.11%
jan 1, 1995
22.643 bln
+13.181 bln
139.3%
jan 1, 1996
35.189 bln
+12.546 bln
55.41%
jan 1, 1997
35.444 bln
+255.4 mln
0.73%
jan 1, 1998
39.014 bln
+3.57 bln
10.07%
jan 1, 1999
43.408 bln
+4.393 bln
11.26%
jan 1, 2000
41.171 bln
-2.237 bln
-5.15%
jan 1, 2001
54.404 bln
+13.233 bln
32.14%
jan 1, 2002
43.803 bln
-10.601 bln
-19.49%
jan 1, 2003
53.863 bln
+10.06 bln
22.97%
jan 1, 2004
48.175 bln
-5.688 bln
-10.56%
jan 1, 2005
59.093 bln
+10.918 bln
22.66%
jan 1, 2006
61.212 bln
+2.119 bln
3.59%
jan 1, 2007
71.683 bln
+10.471 bln
17.11%
jan 1, 2008
88.421 bln
+16.738 bln
23.35%
jan 1, 2009
115.89 bln
+27.469 bln
31.07%
jan 1, 2010
106.734 bln
-9.156 bln
-7.9%
jan 1, 2011
106.999 bln
+265.0 mln
0.25%
jan 1, 2012
124.926 bln
+17.927 bln
16.75%
jan 1, 2013
135.003 bln
+10.077 bln
8.07%
jan 1, 2014
144.584 bln
+9.581 bln
7.1%
jan 1, 2015
160.081 bln
+15.497 bln
10.72%
jan 1, 2016
178.492 bln
+18.411 bln
11.5%
Ranking of countries by current statistics by years


Comments: