29
/
en
AIzaSyAYiBZKx7MnpbEhh9jyipgxe19OcubqV5w
April 1, 2024
205313
Namibia
NAM
true
2
1
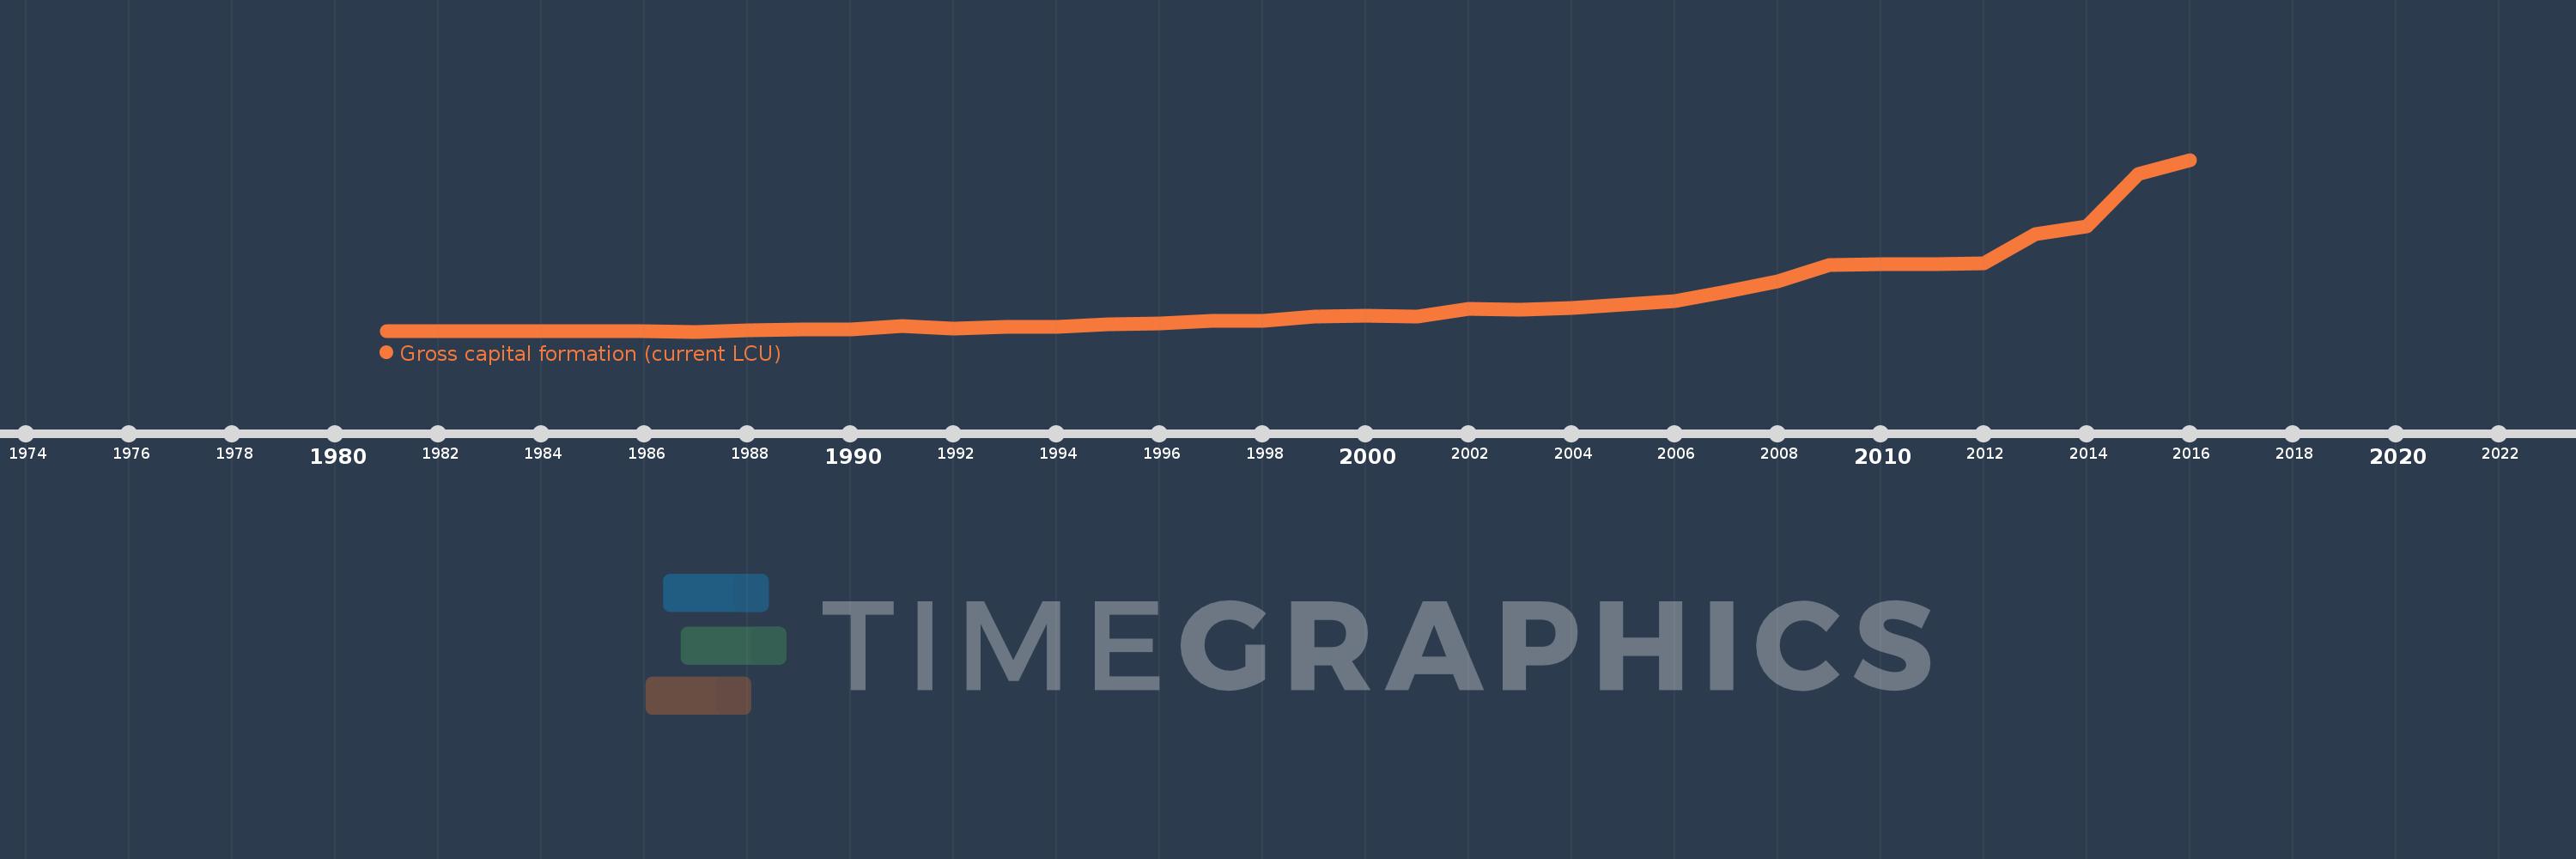
Gross capital formation (current LCU)
2016,2015,2014,2013,2012,2011,2010,2009,2008,2007,2006,2005,2004,2003,2002,2001,2000,1999,1998,1997,1996,1995,1994,1993,1992,1991,1990,1989,1988,1987,1986,1985,1984,1983,1982,1981
This statistics in other country:
AfghanistanAlbaniaAlgeriaAngolaAntigua and BarbudaArgentinaArmeniaArubaAustraliaAustriaAzerbaijanBahamas, TheBahrainBangladeshBarbadosBelarusBelgiumBelizeBeninBermudaBhutanBoliviaBosnia and HerzegovinaBotswanaBrazilBrunei DarussalamBulgariaBurkina FasoBurundiCabo VerdeCambodiaCameroonCanadaCentral African RepublicChadChileChinaColombiaComorosCongo, Dem. Rep.Congo, Rep.Costa RicaCote d'IvoireCroatiaCubaCyprusCzech RepublicDenmarkDjiboutiDominicaDominican RepublicEcuadorEgypt, Arab Rep.El SalvadorEquatorial GuineaEritreaEstoniaEthiopiaFaroe IslandsFijiFinlandFranceGabonGambia, TheGeorgiaGermanyGhanaGreeceGrenadaGuatemalaGuineaGuinea-BissauGuyanaHaitiHondurasHong Kong SAR, ChinaHungaryIcelandIndiaIndonesiaIran, Islamic Rep.IraqIrelandIsraelItalyJamaicaJapanJordanKazakhstanKenyaKiribatiKorea, Rep.KosovoKuwaitKyrgyz RepublicLao PDRLatviaLebanonLesothoLiberiaLibyaLithuaniaLuxembourgMacao SAR, ChinaMacedonia, FYRMadagascarMalawiMalaysiaMaldivesMaliMaltaMauritaniaMauritiusMexicoMicronesia, Fed. Sts.MoldovaMongoliaMontenegroMoroccoMozambiqueNamibiaNepalNetherlandsNew CaledoniaNew ZealandNicaraguaNigerNigeriaNorwayOmanPakistanPanamaPapua New GuineaParaguayPeruPhilippinesPolandPortugalPuerto RicoQatarRomaniaRussian FederationRwandaSaudi ArabiaSenegalSerbiaSeychellesSierra LeoneSingaporeSlovak RepublicSloveniaSolomon IslandsSomaliaSouth AfricaSouth SudanSpainSri LankaSt. Kitts and NevisSt. LuciaSt. Vincent and the GrenadinesSudanSurinameSwazilandSwedenSwitzerlandSyrian Arab RepublicTajikistanTanzaniaThailandTimor-LesteTogoTongaTrinidad and TobagoTunisiaTurkeyTurkmenistanUgandaUkraineUnited Arab EmiratesUnited KingdomUnited StatesUruguayUzbekistanVanuatuVenezuela, RBVietnamWest Bank and GazaYemen, Rep.ZambiaZimbabwe Timeline:
This timeline shows a graph from 1981 to 2016 of Namibia. No data until 1980. Number of actual observations by date: 36.
Source name:
World Development Indicators
Source organization:
World Bank national accounts data, and OECD National Accounts data files.
Categories, topics:
Economy & Growth
Last updated:
apr 23, 2017
Indicators value changes by year
Minimum:
336.315 mln
jan 1, 1987
Maximum:
50.123 bln
jan 1, 2016
At the date of observation
Value
Absolute change
Change from previous value
jan 1, 1981
451.192 mln
+451.192 mln
0.0%
jan 1, 1982
455.055 mln
+3.863 mln
0.86%
jan 1, 1983
419.651 mln
-35.404 mln
-7.78%
jan 1, 1984
437.238 mln
+17.586 mln
4.19%
jan 1, 1985
379.866 mln
-57.372 mln
-13.12%
jan 1, 1986
355.41 mln
-24.456 mln
-6.44%
jan 1, 1987
336.315 mln
-19.095 mln
-5.37%
jan 1, 1988
600.602 mln
+264.287 mln
78.58%
jan 1, 1989
852.004 mln
+251.402 mln
41.86%
jan 1, 1990
985.697 mln
+133.693 mln
15.69%
jan 1, 1991
1.953 bln
+967.431 mln
98.15%
jan 1, 1992
1.276 bln
-676.953 mln
-34.66%
jan 1, 1993
1.805 bln
+528.522 mln
41.41%
jan 1, 1994
1.624 bln
-180.411 mln
-10.0%
jan 1, 1995
2.482 bln
+858.134 mln
52.83%
jan 1, 1996
2.792 bln
+309.577 mln
12.47%
jan 1, 1997
3.512 bln
+719.799 mln
25.78%
jan 1, 1998
3.393 bln
-119.188 mln
-3.39%
jan 1, 1999
4.785 bln
+1.393 bln
41.05%
jan 1, 2000
4.848 bln
+62.238 mln
1.3%
jan 1, 2001
4.639 bln
-209.057 mln
-4.31%
jan 1, 2002
6.815 bln
+2.176 bln
46.92%
jan 1, 2003
6.562 bln
-252.784 mln
-3.71%
jan 1, 2004
7.225 bln
+663.251 mln
10.11%
jan 1, 2005
8.138 bln
+912.082 mln
12.62%
jan 1, 2006
9.093 bln
+955.181 mln
11.74%
jan 1, 2007
12.028 bln
+2.935 bln
32.28%
jan 1, 2008
15.004 bln
+2.976 bln
24.75%
jan 1, 2009
19.514 bln
+4.51 bln
30.06%
jan 1, 2010
19.896 bln
+382.493 mln
1.96%
jan 1, 2011
19.926 bln
+30.272 mln
0.15%
jan 1, 2012
20.163 bln
+236.483 mln
1.19%
jan 1, 2013
28.558 bln
+8.395 bln
41.63%
jan 1, 2014
30.945 bln
+2.387 bln
8.36%
jan 1, 2015
46.009 bln
+15.065 bln
48.68%
jan 1, 2016
50.123 bln
+4.113 bln
8.94%
Ranking of countries by current statistics by years


Comments: