29
/
en
AIzaSyAYiBZKx7MnpbEhh9jyipgxe19OcubqV5w
April 1, 2024
249912
St. Kitts and Nevis
KNA
true
2
1
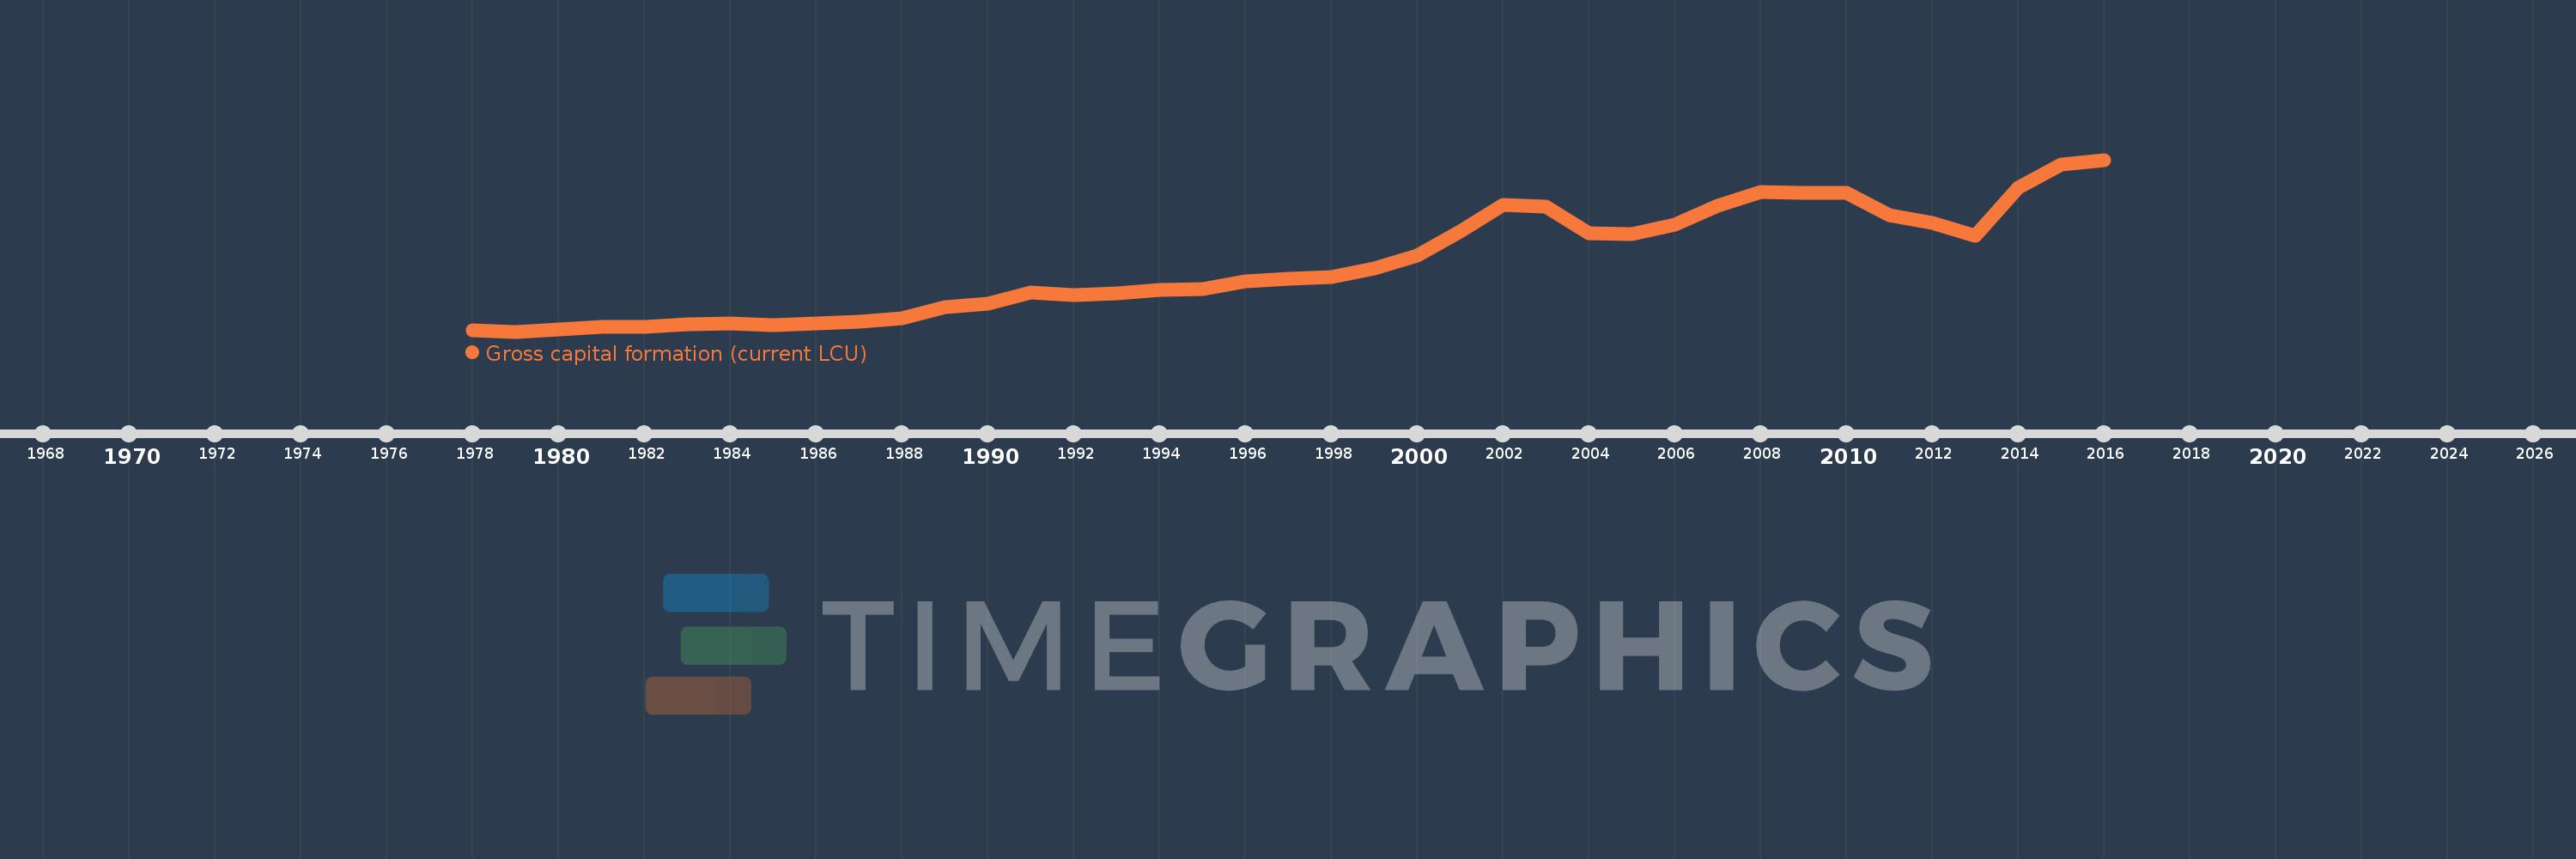
Gross capital formation (current LCU)
2016,2015,2014,2013,2012,2011,2010,2009,2008,2007,2006,2005,2004,2003,2002,2001,2000,1999,1998,1997,1996,1995,1994,1993,1992,1991,1990,1989,1988,1987,1986,1985,1984,1983,1982,1981,1980,1979,1978
This statistics in other country:
AfghanistanAlbaniaAlgeriaAngolaAntigua and BarbudaArgentinaArmeniaArubaAustraliaAustriaAzerbaijanBahamas, TheBahrainBangladeshBarbadosBelarusBelgiumBelizeBeninBermudaBhutanBoliviaBosnia and HerzegovinaBotswanaBrazilBrunei DarussalamBulgariaBurkina FasoBurundiCabo VerdeCambodiaCameroonCanadaCentral African RepublicChadChileChinaColombiaComorosCongo, Dem. Rep.Congo, Rep.Costa RicaCote d'IvoireCroatiaCubaCyprusCzech RepublicDenmarkDjiboutiDominicaDominican RepublicEcuadorEgypt, Arab Rep.El SalvadorEquatorial GuineaEritreaEstoniaEthiopiaFaroe IslandsFijiFinlandFranceGabonGambia, TheGeorgiaGermanyGhanaGreeceGrenadaGuatemalaGuineaGuinea-BissauGuyanaHaitiHondurasHong Kong SAR, ChinaHungaryIcelandIndiaIndonesiaIran, Islamic Rep.IraqIrelandIsraelItalyJamaicaJapanJordanKazakhstanKenyaKiribatiKorea, Rep.KosovoKuwaitKyrgyz RepublicLao PDRLatviaLebanonLesothoLiberiaLibyaLithuaniaLuxembourgMacao SAR, ChinaMacedonia, FYRMadagascarMalawiMalaysiaMaldivesMaliMaltaMauritaniaMauritiusMexicoMicronesia, Fed. Sts.MoldovaMongoliaMontenegroMoroccoMozambiqueNamibiaNepalNetherlandsNew CaledoniaNew ZealandNicaraguaNigerNigeriaNorwayOmanPakistanPanamaPapua New GuineaParaguayPeruPhilippinesPolandPortugalPuerto RicoQatarRomaniaRussian FederationRwandaSaudi ArabiaSenegalSerbiaSeychellesSierra LeoneSingaporeSlovak RepublicSloveniaSolomon IslandsSomaliaSouth AfricaSouth SudanSpainSri LankaSt. Kitts and NevisSt. LuciaSt. Vincent and the GrenadinesSudanSurinameSwazilandSwedenSwitzerlandSyrian Arab RepublicTajikistanTanzaniaThailandTimor-LesteTogoTongaTrinidad and TobagoTunisiaTurkeyTurkmenistanUgandaUkraineUnited Arab EmiratesUnited KingdomUnited StatesUruguayUzbekistanVanuatuVenezuela, RBVietnamWest Bank and GazaYemen, Rep.ZambiaZimbabwe Timeline:
This timeline shows a graph from 1978 to 2016 of St. Kitts and Nevis. No data until 1977. Number of actual observations by date: 39.
Source name:
World Development Indicators
Source organization:
World Bank national accounts data, and OECD National Accounts data files.
Categories, topics:
Economy & Growth
Last updated:
apr 23, 2017
Indicators value changes by year
Minimum:
26.11 mln
jan 1, 1979
Maximum:
982.63 mln
jan 1, 2016
At the date of observation
Value
Absolute change
Change from previous value
jan 1, 1978
31.35 mln
+31.35 mln
0.0%
jan 1, 1979
26.11 mln
-5.24 mln
-16.71%
jan 1, 1980
38.62 mln
+12.51 mln
47.91%
jan 1, 1981
50.33 mln
+11.71 mln
30.32%
jan 1, 1982
51.61 mln
+1.28 mln
2.54%
jan 1, 1983
64.69 mln
+13.08 mln
25.34%
jan 1, 1984
71.16 mln
+6.47 mln
10.0%
jan 1, 1985
60.98 mln
-10.18 mln
-14.31%
jan 1, 1986
71.59 mln
+10.61 mln
17.4%
jan 1, 1987
79.34 mln
+7.75 mln
10.83%
jan 1, 1988
101.42 mln
+22.08 mln
27.83%
jan 1, 1989
162.49 mln
+61.07 mln
60.21%
jan 1, 1990
182.56 mln
+20.07 mln
12.35%
jan 1, 1991
246.07 mln
+63.51 mln
34.79%
jan 1, 1992
229.18 mln
-16.89 mln
-6.86%
jan 1, 1993
239.41 mln
+10.23 mln
4.46%
jan 1, 1994
258.58 mln
+19.17 mln
8.01%
jan 1, 1995
264.28 mln
+5.7 mln
2.2%
jan 1, 1996
303.73 mln
+39.45 mln
14.93%
jan 1, 1997
318.9 mln
+15.17 mln
4.99%
jan 1, 1998
332.12 mln
+13.22 mln
4.15%
jan 1, 1999
379.83 mln
+47.71 mln
14.37%
jan 1, 2000
448.42 mln
+68.59 mln
18.06%
jan 1, 2001
583.66 mln
+135.24 mln
30.16%
jan 1, 2002
730.16 mln
+146.5 mln
25.1%
jan 1, 2003
722.78 mln
-7.38 mln
-1.01%
jan 1, 2004
572.29 mln
-150.49 mln
-20.82%
jan 1, 2005
570.7 mln
-1.59 mln
-0.28%
jan 1, 2006
619.36 mln
+48.66 mln
8.53%
jan 1, 2007
726.39 mln
+107.03 mln
17.28%
jan 1, 2008
805.19 mln
+78.8 mln
10.85%
jan 1, 2009
799.55 mln
-5.64 mln
-0.7%
jan 1, 2010
800.12 mln
+570.0K
0.07%
jan 1, 2011
672.61 mln
-127.51 mln
-15.94%
jan 1, 2012
630.14 mln
-42.47 mln
-6.31%
jan 1, 2013
558.62 mln
-71.52 mln
-11.35%
jan 1, 2014
829.23 mln
+270.61 mln
48.44%
jan 1, 2015
954.39 mln
+125.16 mln
15.09%
jan 1, 2016
982.63 mln
+28.24 mln
2.96%
Ranking of countries by current statistics by years


Comments: