29
/
en
AIzaSyAYiBZKx7MnpbEhh9jyipgxe19OcubqV5w
April 1, 2024
143128
Grenada
GRD
true
2
1
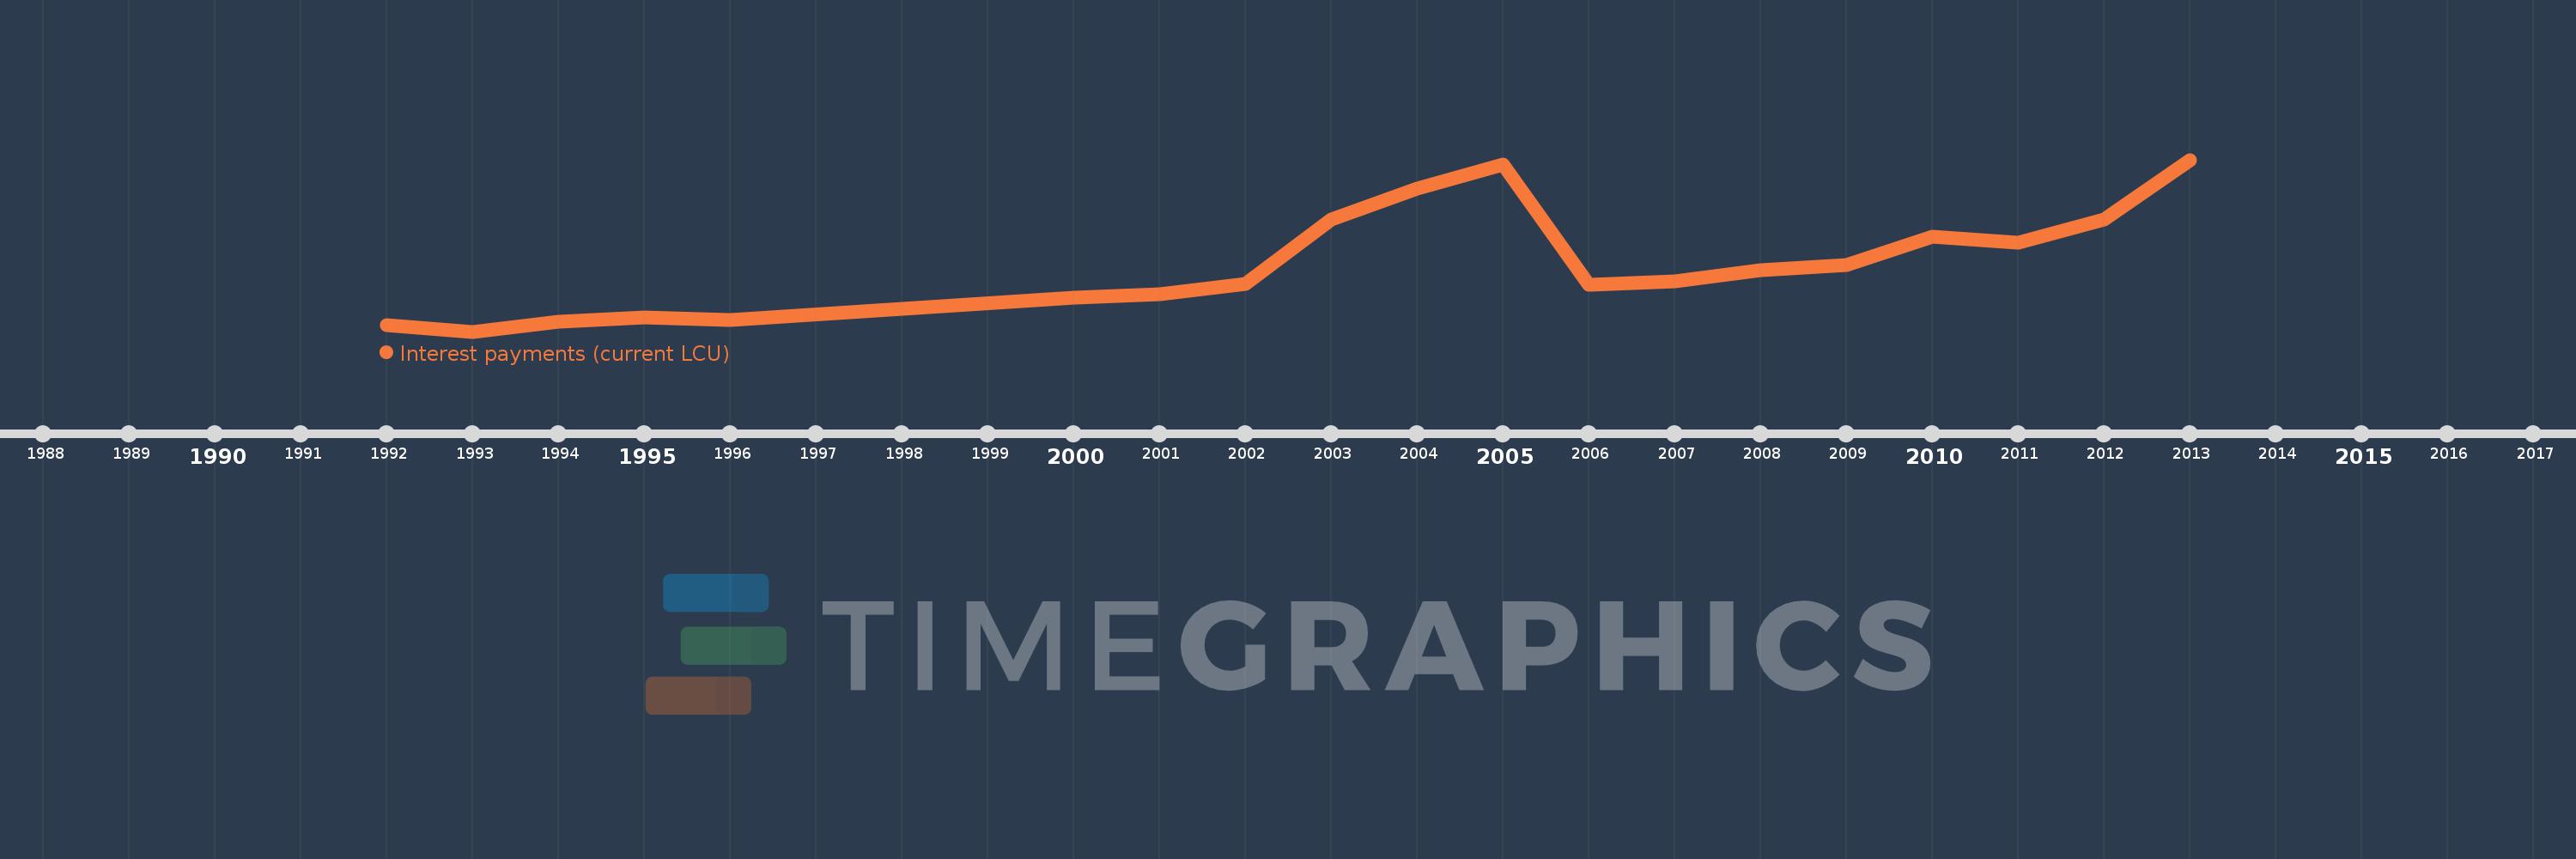
Interest payments (current LCU)
2013,2012,2011,2010,2009,2008,2007,2006,2005,2004,2003,2002,2001,2000,1996,1995,1994,1993,1992
This statistics in other country:
AfghanistanAlbaniaAlgeriaAngolaAntigua and BarbudaArmeniaAustraliaAustriaAzerbaijanBahamas, TheBahrainBangladeshBarbadosBelarusBelgiumBelizeBeninBhutanBoliviaBosnia and HerzegovinaBotswanaBrazilBulgariaBurkina FasoBurundiCabo VerdeCambodiaCanadaCentral African RepublicChileChinaColombiaCongo, Dem. Rep.Congo, Rep.Costa RicaCote d'IvoireCroatiaCyprusCzech RepublicDenmarkDominicaDominican RepublicEgypt, Arab Rep.El SalvadorEquatorial GuineaEstoniaEthiopiaFijiFinlandFranceGambia, TheGeorgiaGermanyGhanaGreeceGrenadaGuatemalaHondurasHong Kong SAR, ChinaHungaryIcelandIndiaIndonesiaIran, Islamic Rep.IraqIrelandIsraelItalyJamaicaJapanJordanKazakhstanKenyaKiribatiKorea, Rep.KuwaitKyrgyz RepublicLao PDRLatviaLebanonLesothoLiberiaLithuaniaLuxembourgMacao SAR, ChinaMacedonia, FYRMadagascarMalawiMalaysiaMaldivesMaliMaltaMauritiusMexicoMicronesia, Fed. Sts.MoldovaMongoliaMoroccoMozambiqueNamibiaNepalNetherlandsNew ZealandNicaraguaNigeriaNorwayOmanPakistanPanamaPapua New GuineaParaguayPeruPhilippinesPolandPortugalQatarRomaniaRussian FederationRwandaSamoaSan MarinoSao Tome and PrincipeSenegalSerbiaSeychellesSierra LeoneSingaporeSlovak RepublicSloveniaSolomon IslandsSouth AfricaSpainSri LankaSt. Kitts and NevisSt. LuciaSurinameSwazilandSwedenSwitzerlandSyrian Arab RepublicTajikistanTanzaniaThailandTimor-LesteTogoTrinidad and TobagoTunisiaTurkeyUgandaUkraineUnited KingdomUnited StatesUruguayVanuatuVenezuela, RBVietnamWest Bank and GazaYemen, Rep.ZambiaZimbabwe Timeline:
This timeline shows a graph from 1992 to 2013 of Grenada. No data until 1991. Number of actual observations by date: 19.
Source name:
World Development Indicators
Source organization:
International Monetary Fund, Government Finance Statistics Yearbook and data files.
Categories, topics:
Public Sector
Last updated:
apr 23, 2017
Indicators value changes by year
Minimum:
10.44 mln
jan 1, 1993
Maximum:
73.6 mln
jan 1, 2013
At the date of observation
Value
Absolute change
Change from previous value
jan 1, 1992
12.85 mln
+12.85 mln
0.0%
jan 1, 1993
10.44 mln
-2.41 mln
-18.75%
jan 1, 1994
14.1 mln
+3.66 mln
35.06%
jan 1, 1995
15.66 mln
+1.56 mln
11.06%
jan 1, 1996
14.59 mln
-1.07 mln
-6.83%
jan 1, 2000
23.0 mln
+8.41 mln
57.64%
jan 1, 2001
24.2 mln
+1.2 mln
5.22%
jan 1, 2002
27.9 mln
+3.7 mln
15.29%
jan 1, 2003
51.8 mln
+23.9 mln
85.66%
jan 1, 2004
63.1 mln
+11.3 mln
21.81%
jan 1, 2005
71.8 mln
+8.7 mln
13.79%
jan 1, 2006
27.8 mln
-44.0 mln
-61.28%
jan 1, 2007
29.0 mln
+1.2 mln
4.32%
jan 1, 2008
33.0 mln
+4.0 mln
13.79%
jan 1, 2009
34.9 mln
+1.9 mln
5.76%
jan 1, 2010
45.3 mln
+10.4 mln
29.8%
jan 1, 2011
43.0 mln
-2.3 mln
-5.08%
jan 1, 2012
51.6 mln
+8.6 mln
20.0%
jan 1, 2013
73.6 mln
+22.0 mln
42.64%
Ranking of countries by current statistics by years


Comments: