29
/
en
AIzaSyAYiBZKx7MnpbEhh9jyipgxe19OcubqV5w
April 1, 2024
138192
Georgia
GEO
true
2
1
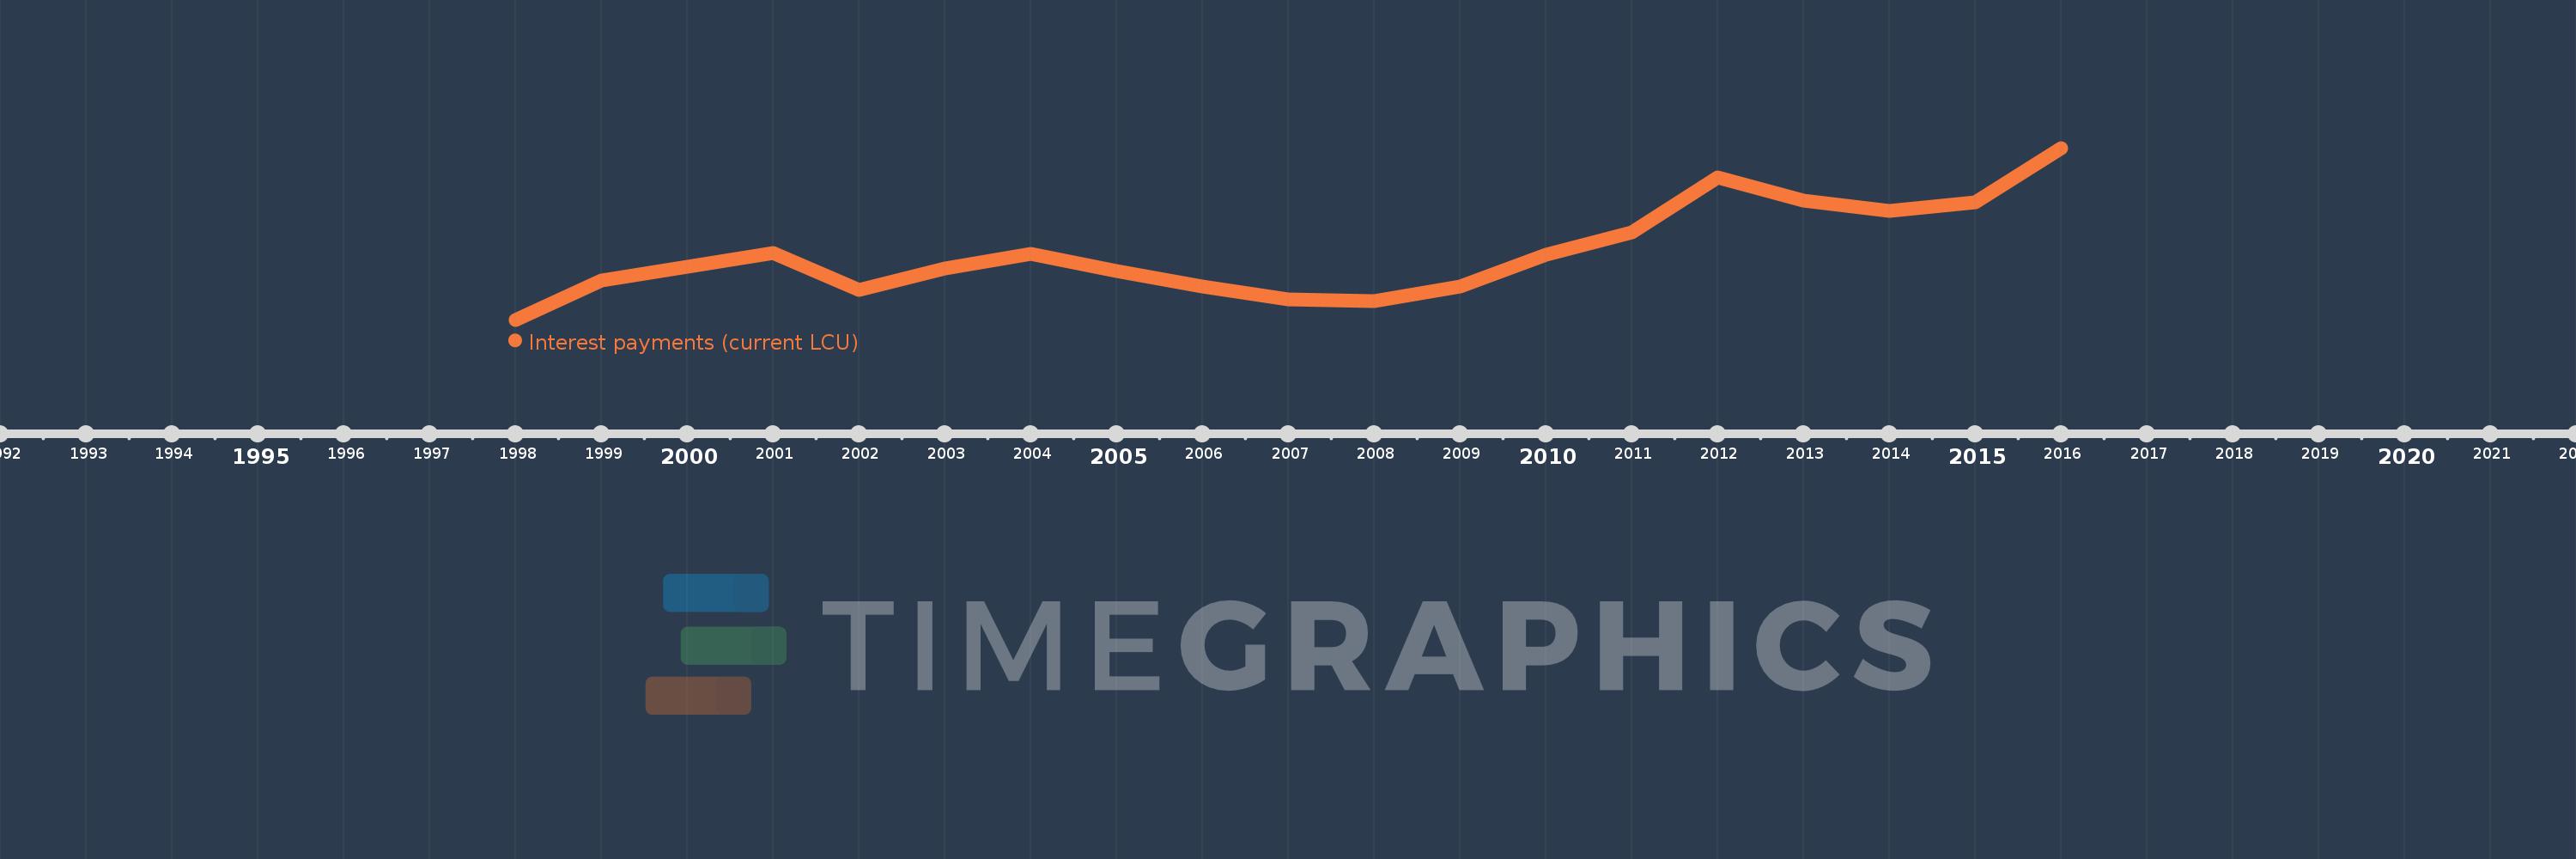
Interest payments (current LCU)
2016,2015,2014,2013,2012,2011,2010,2009,2008,2007,2006,2005,2004,2003,2002,2001,2000,1999,1998
This statistics in other country:
AfghanistanAlbaniaAlgeriaAngolaAntigua and BarbudaArmeniaAustraliaAustriaAzerbaijanBahamas, TheBahrainBangladeshBarbadosBelarusBelgiumBelizeBeninBhutanBoliviaBosnia and HerzegovinaBotswanaBrazilBulgariaBurkina FasoBurundiCabo VerdeCambodiaCanadaCentral African RepublicChileChinaColombiaCongo, Dem. Rep.Congo, Rep.Costa RicaCote d'IvoireCroatiaCyprusCzech RepublicDenmarkDominicaDominican RepublicEgypt, Arab Rep.El SalvadorEquatorial GuineaEstoniaEthiopiaFijiFinlandFranceGambia, TheGeorgiaGermanyGhanaGreeceGrenadaGuatemalaHondurasHong Kong SAR, ChinaHungaryIcelandIndiaIndonesiaIran, Islamic Rep.IraqIrelandIsraelItalyJamaicaJapanJordanKazakhstanKenyaKiribatiKorea, Rep.KuwaitKyrgyz RepublicLao PDRLatviaLebanonLesothoLiberiaLithuaniaLuxembourgMacao SAR, ChinaMacedonia, FYRMadagascarMalawiMalaysiaMaldivesMaliMaltaMauritiusMexicoMicronesia, Fed. Sts.MoldovaMongoliaMoroccoMozambiqueNamibiaNepalNetherlandsNew ZealandNicaraguaNigeriaNorwayOmanPakistanPanamaPapua New GuineaParaguayPeruPhilippinesPolandPortugalQatarRomaniaRussian FederationRwandaSamoaSan MarinoSao Tome and PrincipeSenegalSerbiaSeychellesSierra LeoneSingaporeSlovak RepublicSloveniaSolomon IslandsSouth AfricaSpainSri LankaSt. Kitts and NevisSt. LuciaSurinameSwazilandSwedenSwitzerlandSyrian Arab RepublicTajikistanTanzaniaThailandTimor-LesteTogoTrinidad and TobagoTunisiaTurkeyUgandaUkraineUnited KingdomUnited StatesUruguayVanuatuVenezuela, RBVietnamWest Bank and GazaYemen, Rep.ZambiaZimbabwe Timeline:
This timeline shows a graph from 1998 to 2016 of Georgia. No data until 1997. Number of actual observations by date: 19.
Source name:
World Development Indicators
Source organization:
International Monetary Fund, Government Finance Statistics Yearbook and data files.
Categories, topics:
Public Sector
Last updated:
apr 23, 2017
Indicators value changes by year
Minimum:
70.1 mln
jan 1, 1998
Maximum:
326.6 mln
jan 1, 2016
At the date of observation
Value
Absolute change
Change from previous value
jan 1, 1998
70.1 mln
+70.1 mln
0.0%
jan 1, 1999
128.1 mln
+58.0 mln
82.74%
jan 1, 2000
148.6 mln
+20.5 mln
16.0%
jan 1, 2001
169.8 mln
+21.2 mln
14.27%
jan 1, 2002
115.0 mln
-54.8 mln
-32.27%
jan 1, 2003
146.7 mln
+31.7 mln
27.57%
jan 1, 2004
168.5 mln
+21.8 mln
14.86%
jan 1, 2005
142.4 mln
-26.1 mln
-15.49%
jan 1, 2006
120.1 mln
-22.3 mln
-15.66%
jan 1, 2007
100.5 mln
-19.6 mln
-16.32%
jan 1, 2008
97.4 mln
-3.1 mln
-3.08%
jan 1, 2009
119.3 mln
+21.9 mln
22.48%
jan 1, 2010
167.2 mln
+47.9 mln
40.15%
jan 1, 2011
200.7 mln
+33.5 mln
20.04%
jan 1, 2012
282.7 mln
+82.0 mln
40.86%
jan 1, 2013
248.3 mln
-34.4 mln
-12.17%
jan 1, 2014
233.0 mln
-15.3 mln
-6.16%
jan 1, 2015
244.9 mln
+11.9 mln
5.11%
jan 1, 2016
326.6 mln
+81.7 mln
33.36%
Ranking of countries by current statistics by years


Comments: