29
/
en
AIzaSyAYiBZKx7MnpbEhh9jyipgxe19OcubqV5w
April 1, 2024
229919
Russian Federation
RUS
true
2
1
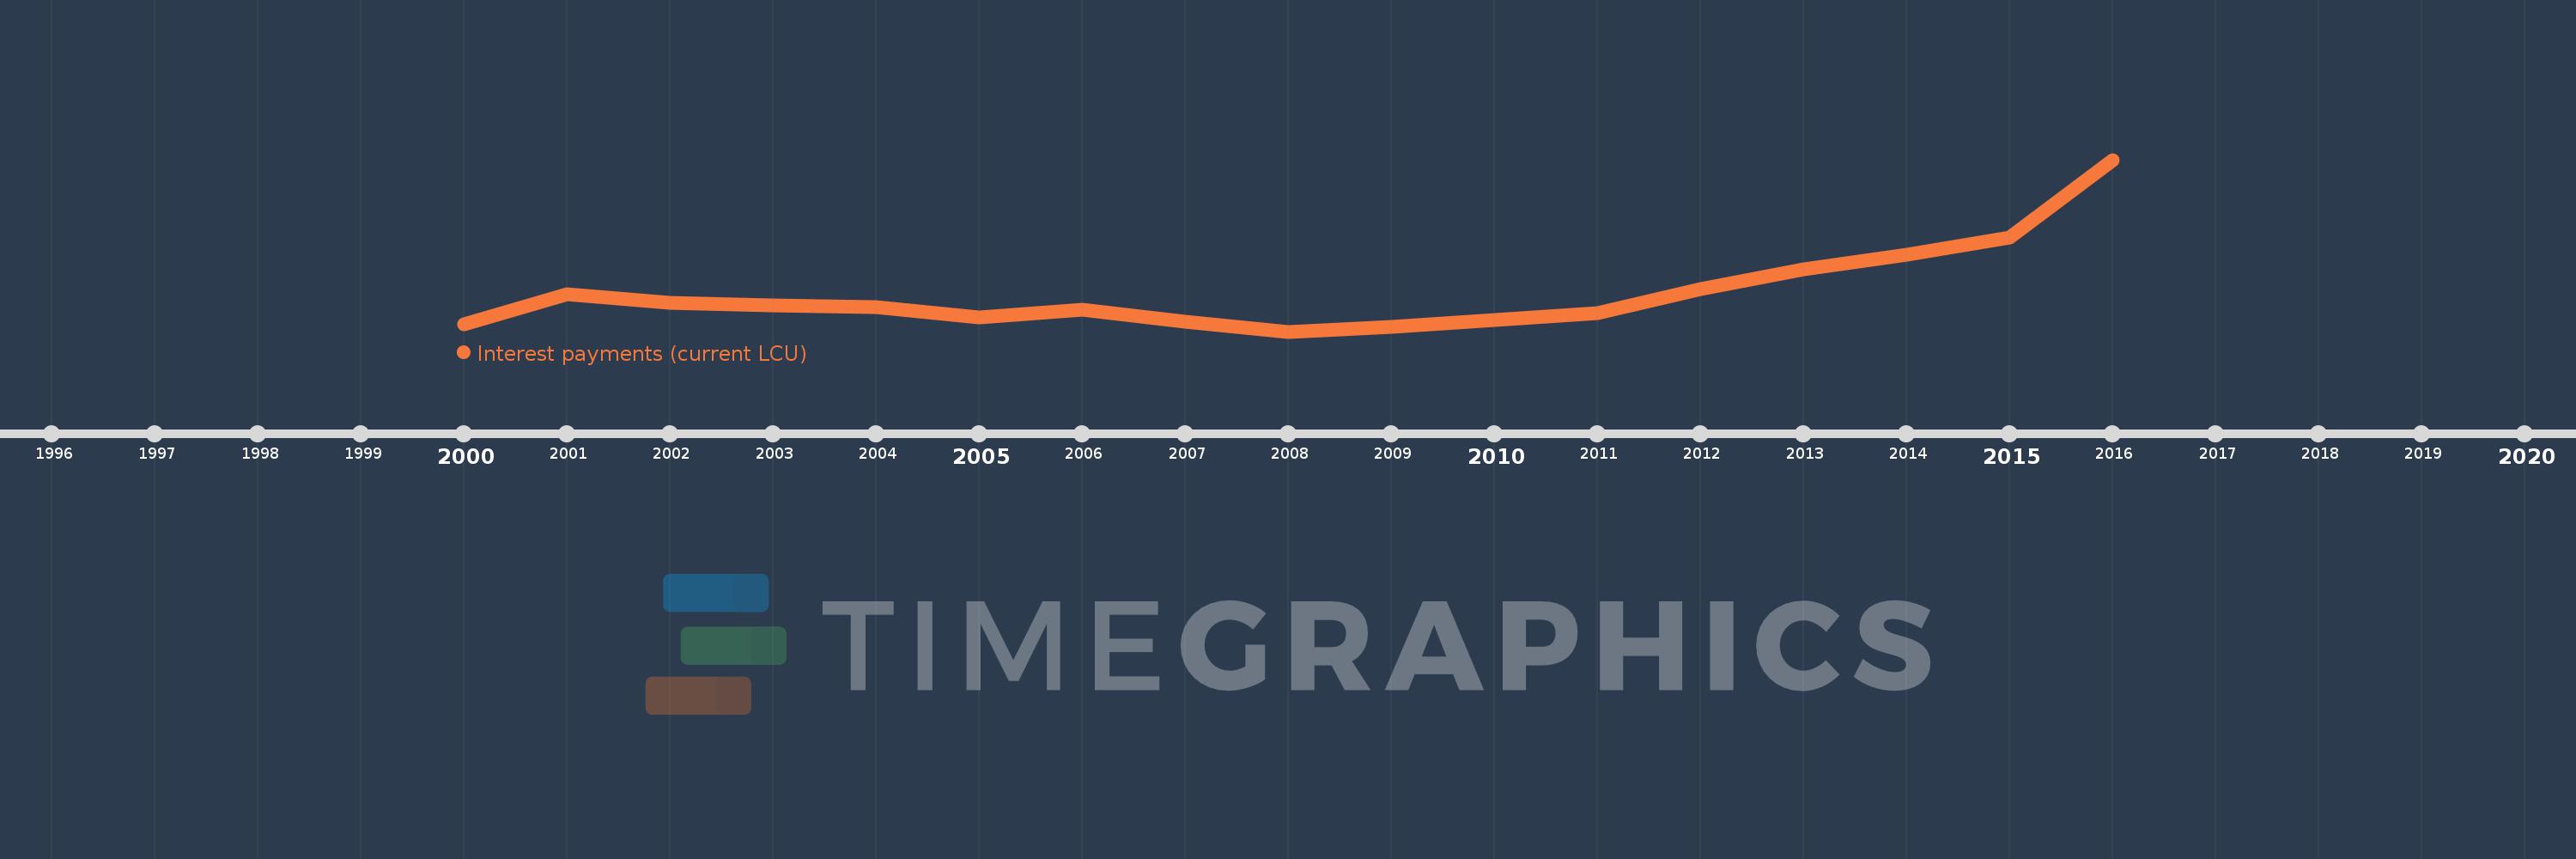
Interest payments (current LCU)
2016,2015,2014,2013,2012,2011,2010,2009,2008,2007,2006,2005,2004,2003,2002,2001,2000
This statistics in other country:
AfghanistanAlbaniaAlgeriaAngolaAntigua and BarbudaArmeniaAustraliaAustriaAzerbaijanBahamas, TheBahrainBangladeshBarbadosBelarusBelgiumBelizeBeninBhutanBoliviaBosnia and HerzegovinaBotswanaBrazilBulgariaBurkina FasoBurundiCabo VerdeCambodiaCanadaCentral African RepublicChileChinaColombiaCongo, Dem. Rep.Congo, Rep.Costa RicaCote d'IvoireCroatiaCyprusCzech RepublicDenmarkDominicaDominican RepublicEgypt, Arab Rep.El SalvadorEquatorial GuineaEstoniaEthiopiaFijiFinlandFranceGambia, TheGeorgiaGermanyGhanaGreeceGrenadaGuatemalaHondurasHong Kong SAR, ChinaHungaryIcelandIndiaIndonesiaIran, Islamic Rep.IraqIrelandIsraelItalyJamaicaJapanJordanKazakhstanKenyaKiribatiKorea, Rep.KuwaitKyrgyz RepublicLao PDRLatviaLebanonLesothoLiberiaLithuaniaLuxembourgMacao SAR, ChinaMacedonia, FYRMadagascarMalawiMalaysiaMaldivesMaliMaltaMauritiusMexicoMicronesia, Fed. Sts.MoldovaMongoliaMoroccoMozambiqueNamibiaNepalNetherlandsNew ZealandNicaraguaNigeriaNorwayOmanPakistanPanamaPapua New GuineaParaguayPeruPhilippinesPolandPortugalQatarRomaniaRussian FederationRwandaSamoaSan MarinoSao Tome and PrincipeSenegalSerbiaSeychellesSierra LeoneSingaporeSlovak RepublicSloveniaSolomon IslandsSouth AfricaSpainSri LankaSt. Kitts and NevisSt. LuciaSurinameSwazilandSwedenSwitzerlandSyrian Arab RepublicTajikistanTanzaniaThailandTimor-LesteTogoTrinidad and TobagoTunisiaTurkeyUgandaUkraineUnited KingdomUnited StatesUruguayVanuatuVenezuela, RBVietnamWest Bank and GazaYemen, Rep.ZambiaZimbabwe Timeline:
This timeline shows a graph from 2000 to 2016 of Russian Federation. No data until 1999. Number of actual observations by date: 17.
Source name:
World Development Indicators
Source organization:
International Monetary Fund, Government Finance Statistics Yearbook and data files.
Categories, topics:
Public Sector
Last updated:
apr 23, 2017
Indicators value changes by year
Minimum:
140.7 bln
jan 1, 2008
Maximum:
677.65 bln
jan 1, 2016
At the date of observation
Value
Absolute change
Change from previous value
jan 1, 2000
162.862 bln
+162.862 bln
0.0%
jan 1, 2001
257.853 bln
+94.991 bln
58.33%
jan 1, 2002
231.11 bln
-26.743 bln
-10.37%
jan 1, 2003
222.632 bln
-8.478 bln
-3.67%
jan 1, 2004
218.456 bln
-4.176 bln
-1.88%
jan 1, 2005
185.864 bln
-32.591 bln
-14.92%
jan 1, 2006
208.34 bln
+22.476 bln
12.09%
jan 1, 2007
172.9 bln
-35.44 bln
-17.01%
jan 1, 2008
140.7 bln
-32.2 bln
-18.62%
jan 1, 2009
155.5 bln
+14.8 bln
10.52%
jan 1, 2010
177.1 bln
+21.6 bln
13.89%
jan 1, 2011
198.0 bln
+20.9 bln
11.8%
jan 1, 2012
272.3 bln
+74.3 bln
37.53%
jan 1, 2013
335.3 bln
+63.0 bln
23.14%
jan 1, 2014
380.8 bln
+45.5 bln
13.57%
jan 1, 2015
433.751 bln
+52.951 bln
13.91%
jan 1, 2016
677.65 bln
+243.898 bln
56.23%
Ranking of countries by current statistics by years


Comments: