29
/
en
AIzaSyAYiBZKx7MnpbEhh9jyipgxe19OcubqV5w
April 1, 2024
219731
Papua New Guinea
PNG
true
2
1
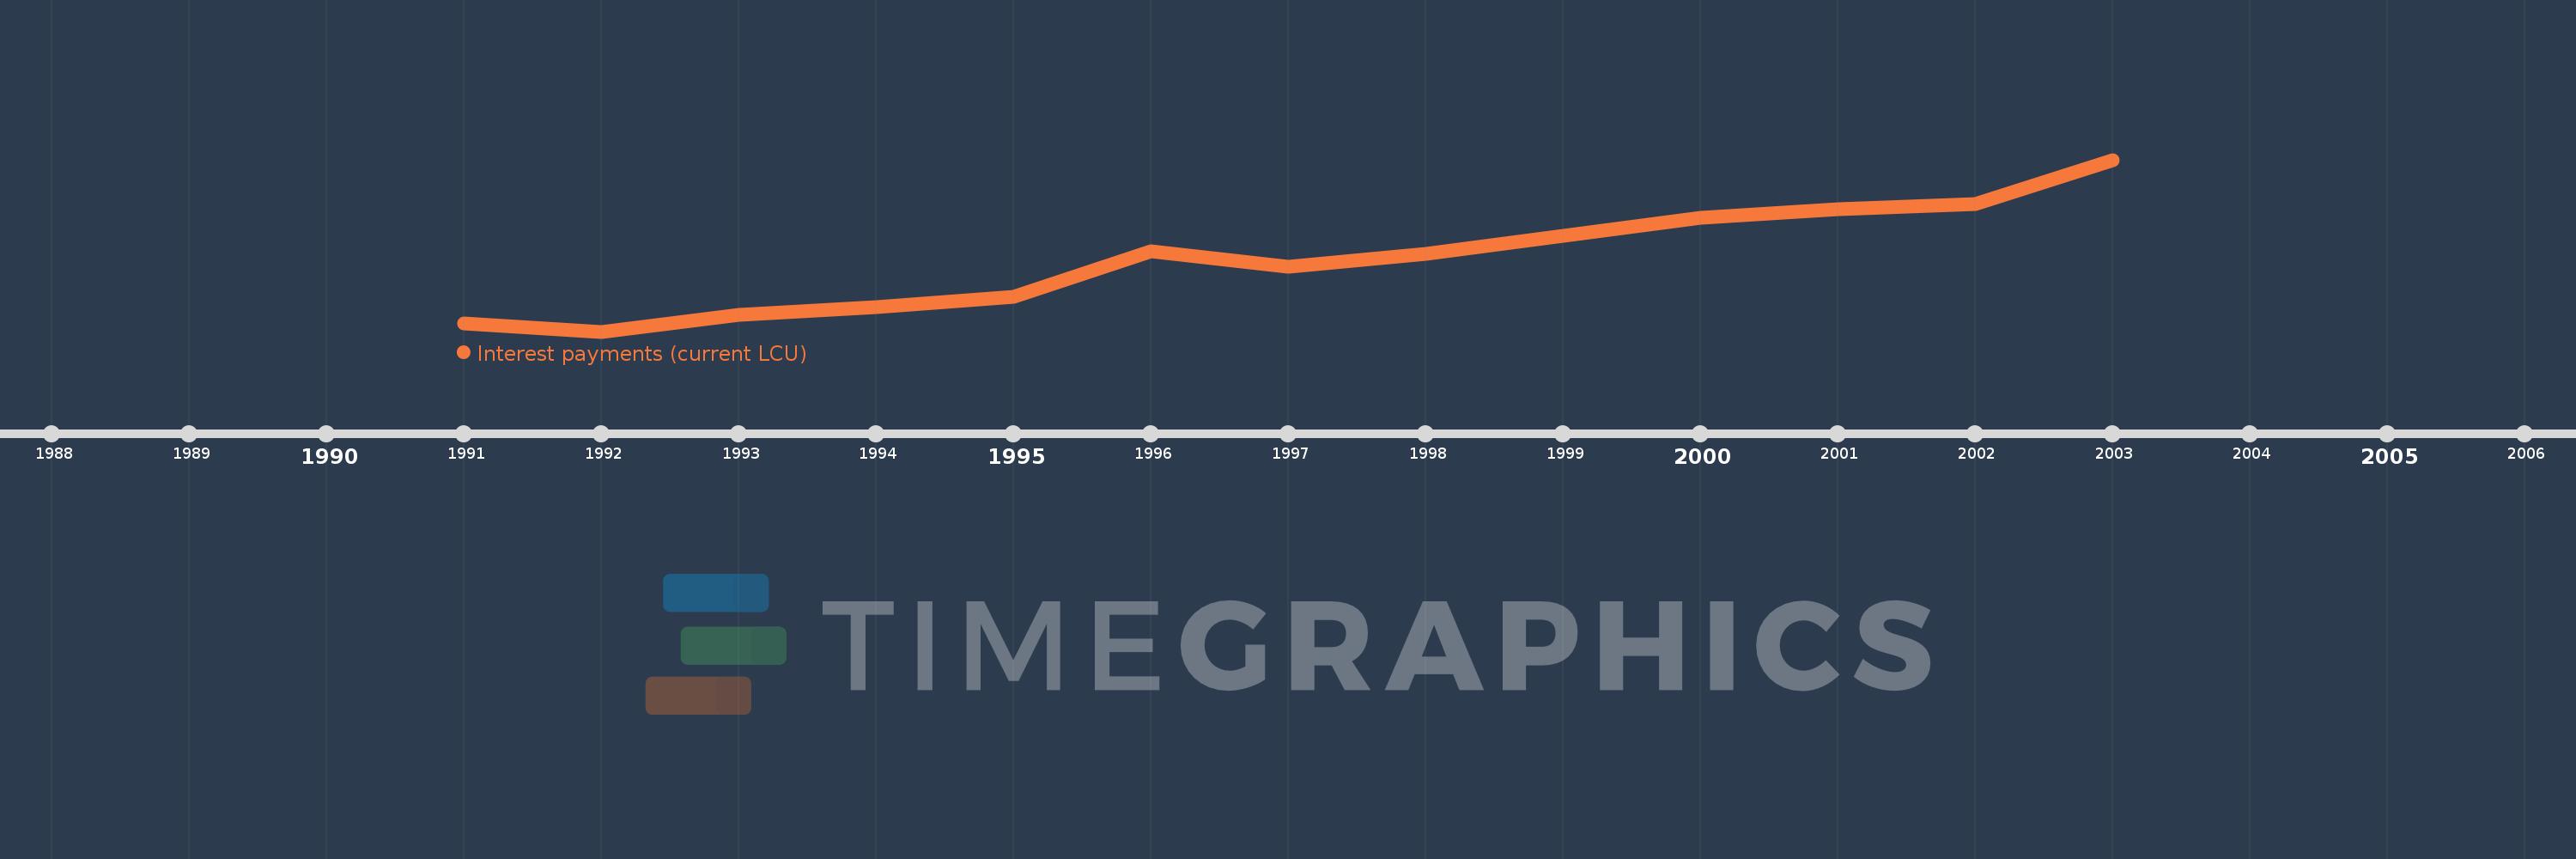
Interest payments (current LCU)
2003,2002,2001,2000,1999,1998,1997,1996,1995,1994,1993,1992,1991
This statistics in other country:
AfghanistanAlbaniaAlgeriaAngolaAntigua and BarbudaArmeniaAustraliaAustriaAzerbaijanBahamas, TheBahrainBangladeshBarbadosBelarusBelgiumBelizeBeninBhutanBoliviaBosnia and HerzegovinaBotswanaBrazilBulgariaBurkina FasoBurundiCabo VerdeCambodiaCanadaCentral African RepublicChileChinaColombiaCongo, Dem. Rep.Congo, Rep.Costa RicaCote d'IvoireCroatiaCyprusCzech RepublicDenmarkDominicaDominican RepublicEgypt, Arab Rep.El SalvadorEquatorial GuineaEstoniaEthiopiaFijiFinlandFranceGambia, TheGeorgiaGermanyGhanaGreeceGrenadaGuatemalaHondurasHong Kong SAR, ChinaHungaryIcelandIndiaIndonesiaIran, Islamic Rep.IraqIrelandIsraelItalyJamaicaJapanJordanKazakhstanKenyaKiribatiKorea, Rep.KuwaitKyrgyz RepublicLao PDRLatviaLebanonLesothoLiberiaLithuaniaLuxembourgMacao SAR, ChinaMacedonia, FYRMadagascarMalawiMalaysiaMaldivesMaliMaltaMauritiusMexicoMicronesia, Fed. Sts.MoldovaMongoliaMoroccoMozambiqueNamibiaNepalNetherlandsNew ZealandNicaraguaNigeriaNorwayOmanPakistanPanamaPapua New GuineaParaguayPeruPhilippinesPolandPortugalQatarRomaniaRussian FederationRwandaSamoaSan MarinoSao Tome and PrincipeSenegalSerbiaSeychellesSierra LeoneSingaporeSlovak RepublicSloveniaSolomon IslandsSouth AfricaSpainSri LankaSt. Kitts and NevisSt. LuciaSurinameSwazilandSwedenSwitzerlandSyrian Arab RepublicTajikistanTanzaniaThailandTimor-LesteTogoTrinidad and TobagoTunisiaTurkeyUgandaUkraineUnited KingdomUnited StatesUruguayVanuatuVenezuela, RBVietnamWest Bank and GazaYemen, Rep.ZambiaZimbabwe Timeline:
This timeline shows a graph from 1991 to 2003 of Papua New Guinea. No data until 1990. Number of actual observations by date: 13.
Source name:
World Development Indicators
Source organization:
International Monetary Fund, Government Finance Statistics Yearbook and data files.
Categories, topics:
Public Sector
Last updated:
apr 23, 2017
Indicators value changes by year
Minimum:
95.96 mln
jan 1, 1992
Maximum:
530.716 mln
jan 1, 2003
At the date of observation
Value
Absolute change
Change from previous value
jan 1, 1991
116.61 mln
+116.61 mln
0.0%
jan 1, 1992
95.96 mln
-20.65 mln
-17.71%
jan 1, 1993
137.89 mln
+41.93 mln
43.7%
jan 1, 1994
157.03 mln
+19.14 mln
13.88%
jan 1, 1995
183.19 mln
+26.16 mln
16.66%
jan 1, 1996
299.64 mln
+116.45 mln
63.57%
jan 1, 1997
260.89 mln
-38.75 mln
-12.93%
jan 1, 1998
293.36 mln
+32.47 mln
12.45%
jan 1, 1999
338.7 mln
+45.34 mln
15.46%
jan 1, 2000
384.05 mln
+45.35 mln
13.39%
jan 1, 2001
406.269 mln
+22.219 mln
5.79%
jan 1, 2002
419.577 mln
+13.308 mln
3.28%
jan 1, 2003
530.716 mln
+111.139 mln
26.49%
Ranking of countries by current statistics by years


Comments: