29
/
en
AIzaSyAYiBZKx7MnpbEhh9jyipgxe19OcubqV5w
April 1, 2024
138703
Georgia
GEO
true
2
1
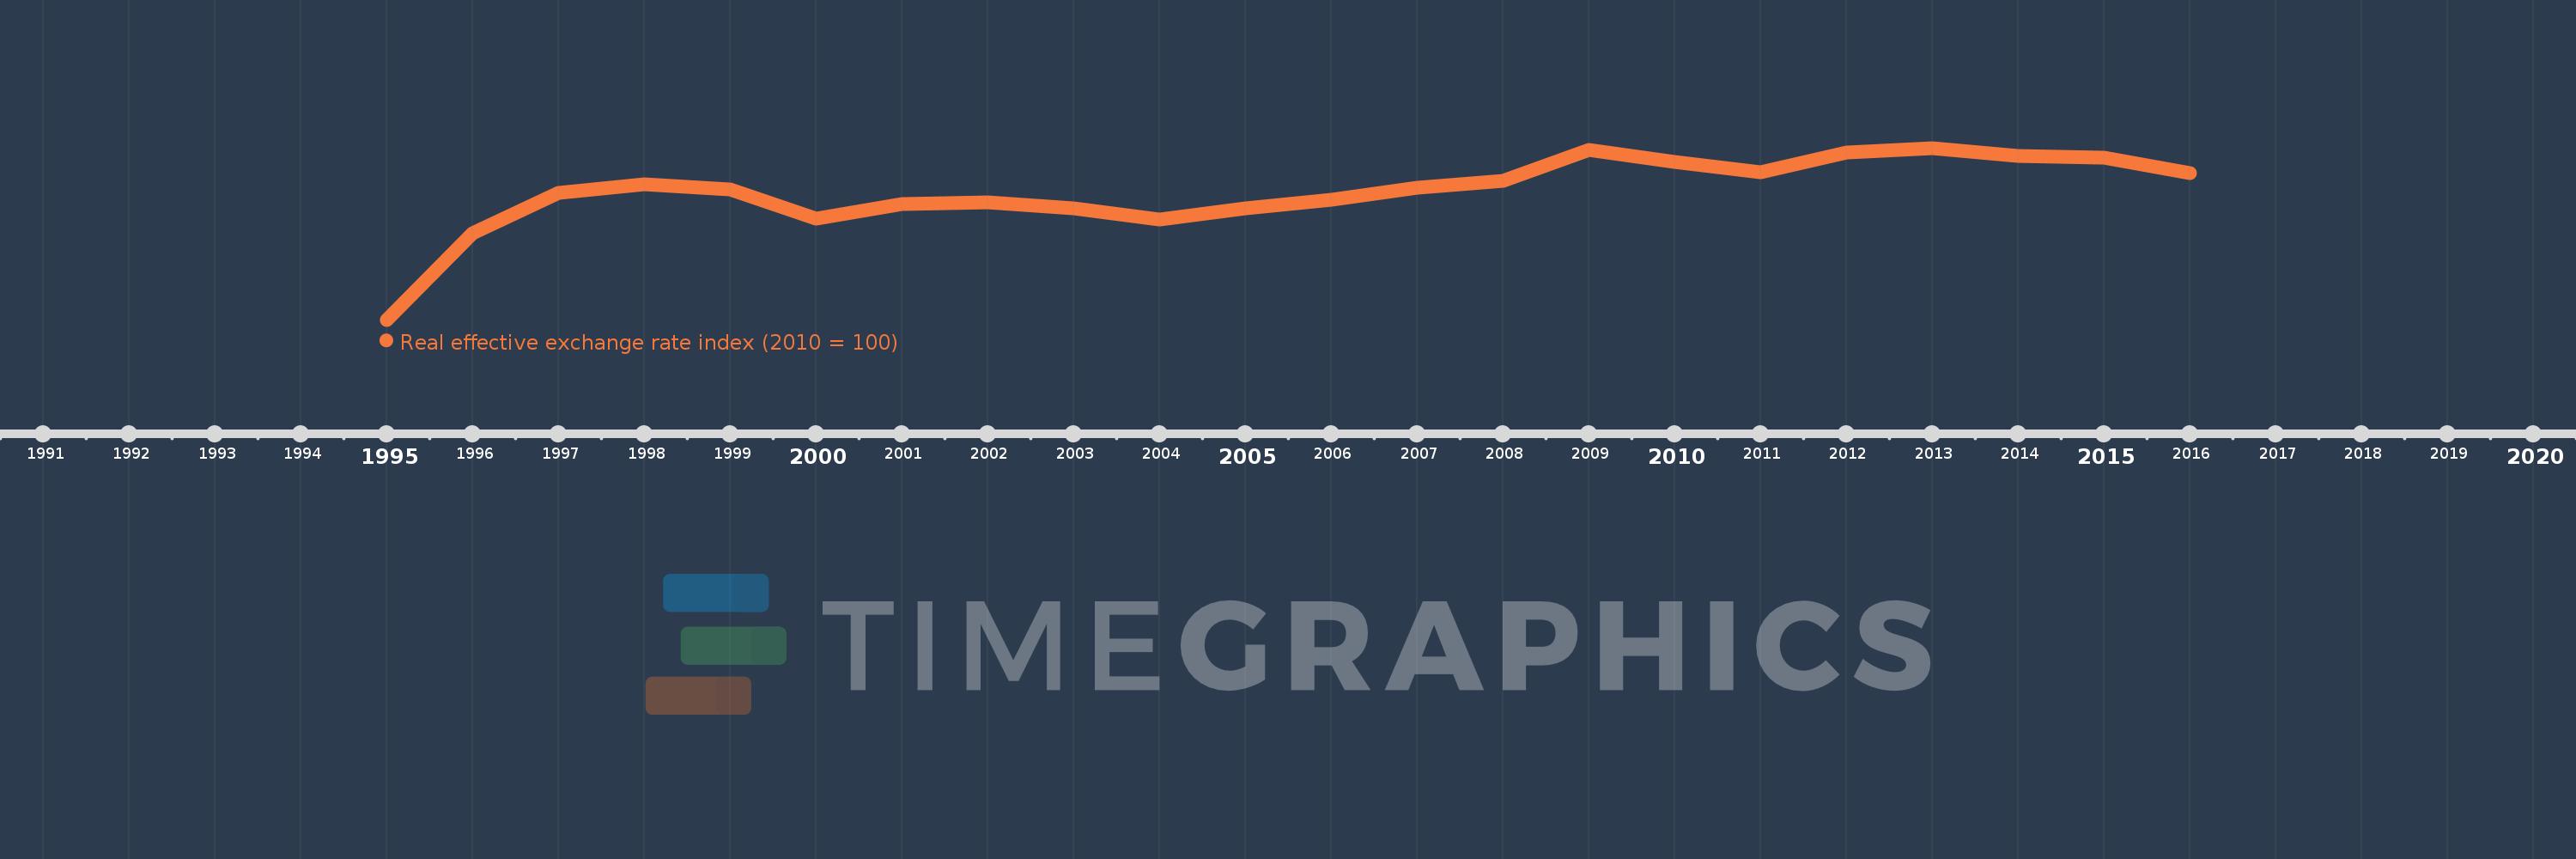
Real effective exchange rate index (2010 = 100)
2016,2015,2014,2013,2012,2011,2010,2009,2008,2007,2006,2005,2004,2003,2002,2001,2000,1999,1998,1997,1996,1995
This statistics in other country:
Timeline:
This timeline shows a graph from 1995 to 2016 of Georgia. No data until 1994. Number of actual observations by date: 22.
Source name:
World Development Indicators
Source organization:
International Monetary Fund, International Financial Statistics.
Categories, topics:
Financial Sector
Last updated:
apr 23, 2017
Indicators value changes by year
Minimum:
32.164
jan 1, 1995
Maximum:
111.292
jan 1, 2013
At the date of observation
Value
Absolute change
Change from previous value
jan 1, 1995
32.164
+32.164
0.0%
jan 1, 1996
71.983
+39.82
123.8%
jan 1, 1997
90.758
+18.774
26.08%
jan 1, 1998
94.644
+3.886
4.28%
jan 1, 1999
92.255
-2.389
-2.52%
jan 1, 2000
78.821
-13.434
-14.56%
jan 1, 2001
85.361
+6.54
8.3%
jan 1, 2002
86.154
+0.792
0.93%
jan 1, 2003
83.333
-2.82
-3.27%
jan 1, 2004
78.148
-5.185
-6.22%
jan 1, 2005
83.301
+5.152
6.59%
jan 1, 2006
87.632
+4.331
5.2%
jan 1, 2007
92.871
+5.24
5.98%
jan 1, 2008
96.214
+3.343
3.6%
jan 1, 2009
110.544
+14.329
14.89%
jan 1, 2010
104.755
-5.789
-5.24%
jan 1, 2011
100.0
-4.755
-4.54%
jan 1, 2012
109.293
+9.293
9.29%
jan 1, 2013
111.292
+1.999
1.83%
jan 1, 2014
107.69
-3.602
-3.24%
jan 1, 2015
106.918
-0.772
-0.72%
jan 1, 2016
99.8
-7.118
-6.66%
Ranking of countries by current statistics by years


Comments: