29
/
en
AIzaSyAYiBZKx7MnpbEhh9jyipgxe19OcubqV5w
April 1, 2024
198221
Moldova
MDA
true
2
1
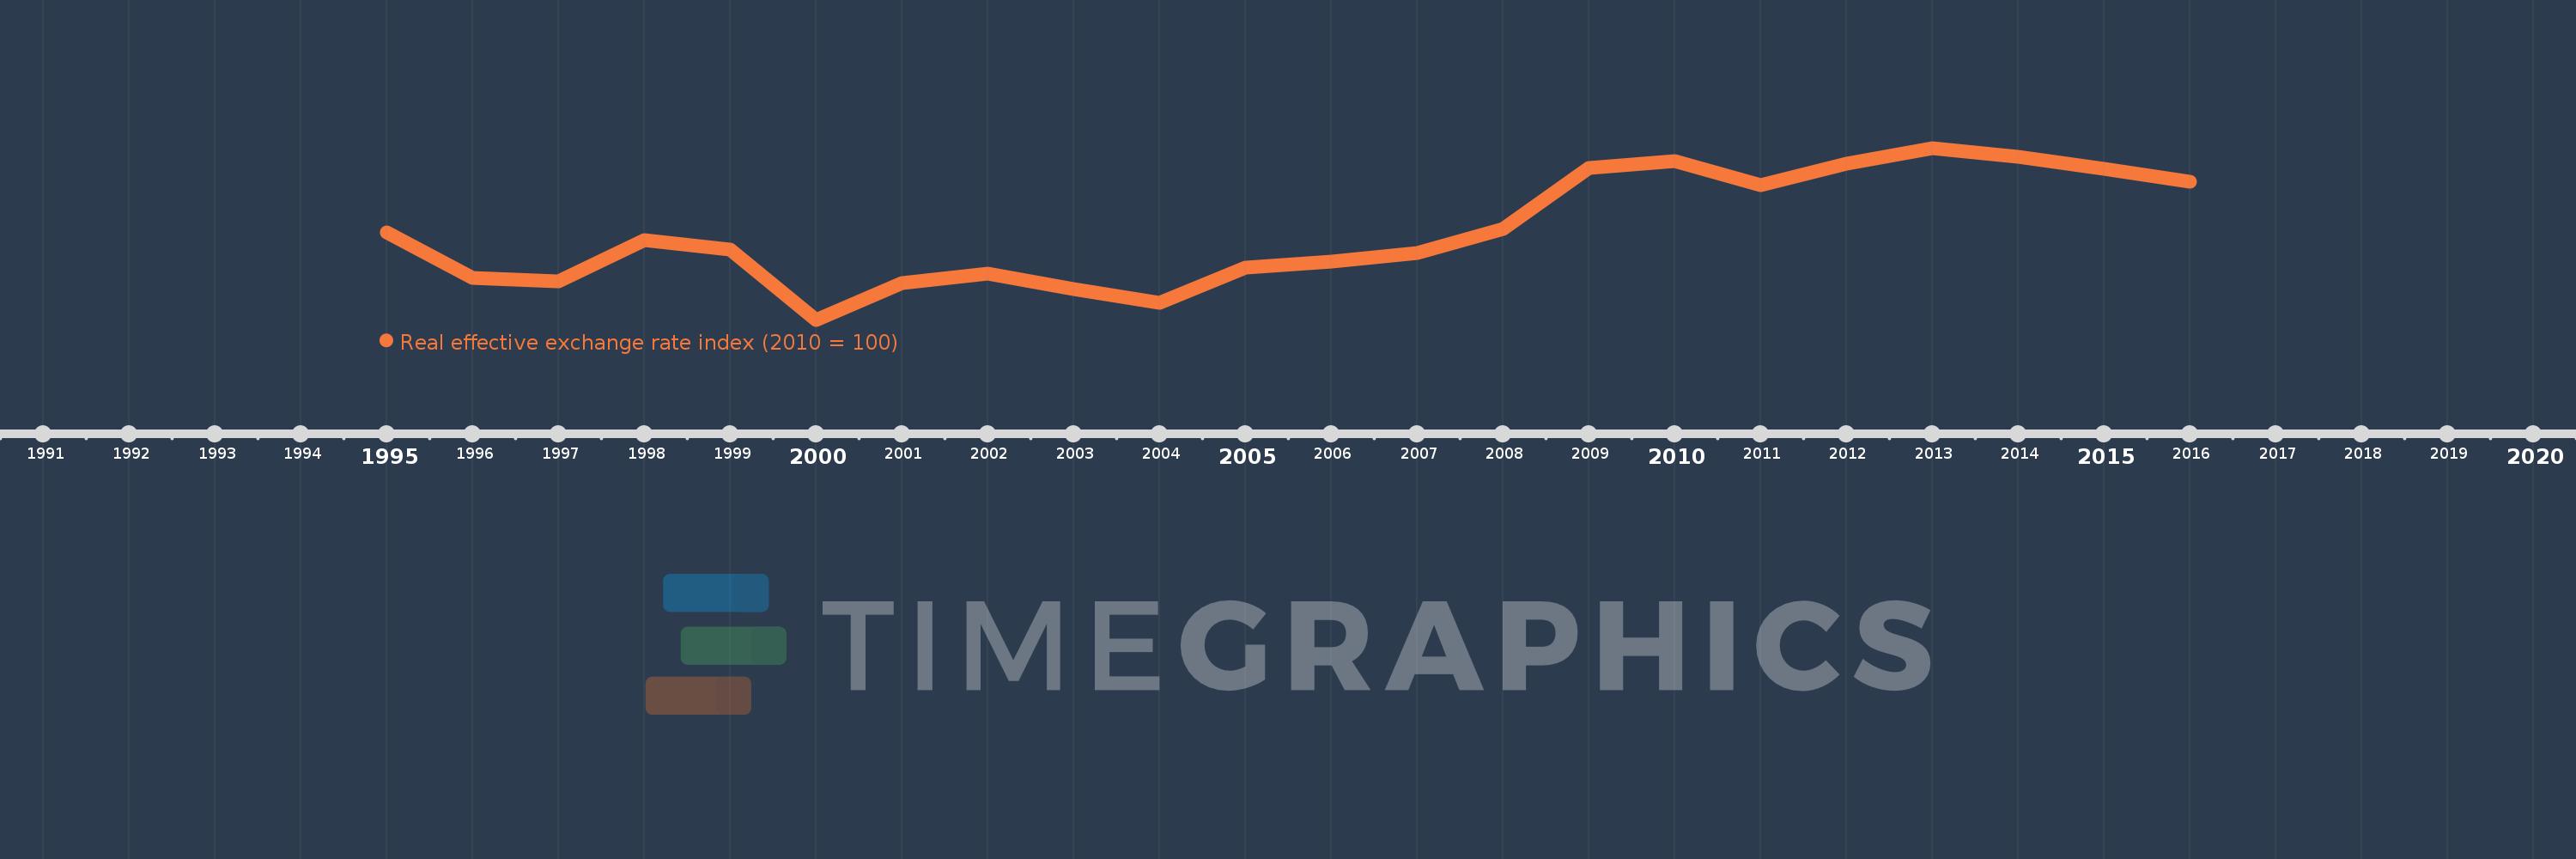
Real effective exchange rate index (2010 = 100)
2016,2015,2014,2013,2012,2011,2010,2009,2008,2007,2006,2005,2004,2003,2002,2001,2000,1999,1998,1997,1996,1995
This statistics in other country:
Timeline:
This timeline shows a graph from 1995 to 2016 of Moldova. No data until 1994. Number of actual observations by date: 22.
Source name:
World Development Indicators
Source organization:
International Monetary Fund, International Financial Statistics.
Categories, topics:
Financial Sector
Last updated:
apr 23, 2017
Indicators value changes by year
Minimum:
62.666
jan 1, 2000
Maximum:
110.21
jan 1, 2013
At the date of observation
Value
Absolute change
Change from previous value
jan 1, 1995
86.817
+86.817
0.0%
jan 1, 1996
74.215
-12.602
-14.52%
jan 1, 1997
73.405
-0.81
-1.09%
jan 1, 1998
84.605
+11.2
15.26%
jan 1, 1999
82.198
-2.406
-2.84%
jan 1, 2000
62.666
-19.532
-23.76%
jan 1, 2001
72.716
+10.05
16.04%
jan 1, 2002
75.321
+2.605
3.58%
jan 1, 2003
71.247
-4.074
-5.41%
jan 1, 2004
67.25
-3.996
-5.61%
jan 1, 2005
76.98
+9.729
14.47%
jan 1, 2006
78.733
+1.754
2.28%
jan 1, 2007
81.054
+2.32
2.95%
jan 1, 2008
87.734
+6.68
8.24%
jan 1, 2009
104.603
+16.87
19.23%
jan 1, 2010
106.514
+1.911
1.83%
jan 1, 2011
100.0
-6.514
-6.12%
jan 1, 2012
105.855
+5.855
5.85%
jan 1, 2013
110.21
+4.355
4.11%
jan 1, 2014
107.67
-2.539
-2.3%
jan 1, 2015
104.386
-3.285
-3.05%
jan 1, 2016
100.776
-3.609
-3.46%
Ranking of countries by current statistics by years


Comments: