29
/
en
AIzaSyAYiBZKx7MnpbEhh9jyipgxe19OcubqV5w
April 1, 2024
71814
Armenia
ARM
true
2
1
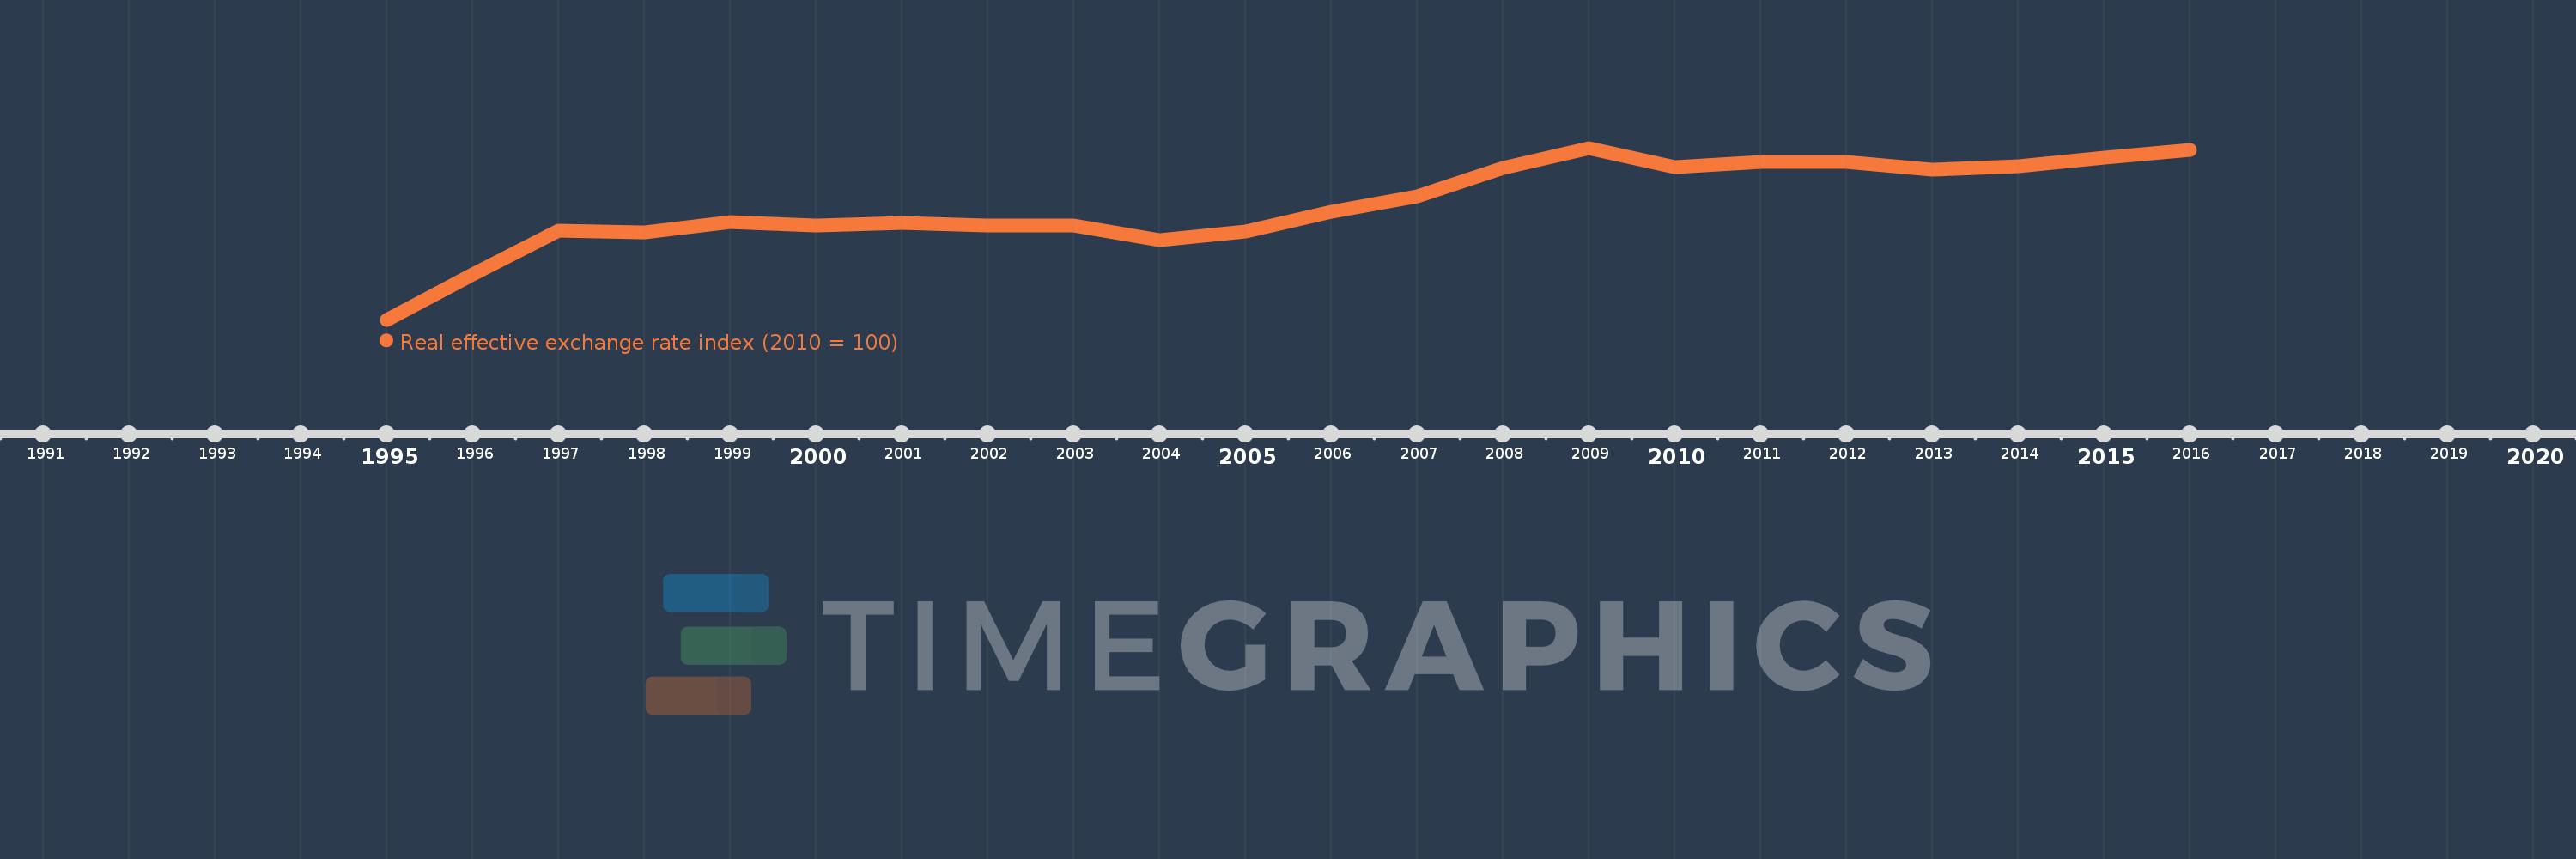
Real effective exchange rate index (2010 = 100)
2016,2015,2014,2013,2012,2011,2010,2009,2008,2007,2006,2005,2004,2003,2002,2001,2000,1999,1998,1997,1996,1995
This statistics in other country:
Timeline:
This timeline shows a graph from 1995 to 2016 of Armenia. No data until 1994. Number of actual observations by date: 22.
Source name:
World Development Indicators
Source organization:
International Monetary Fund, International Financial Statistics.
Categories, topics:
Financial Sector
Last updated:
apr 23, 2017
Indicators value changes by year
Minimum:
33.064
jan 1, 1995
Maximum:
105.864
jan 1, 2009
At the date of observation
Value
Absolute change
Change from previous value
jan 1, 1995
33.064
+33.064
0.0%
jan 1, 1996
52.279
+19.215
58.12%
jan 1, 1997
70.975
+18.696
35.76%
jan 1, 1998
69.939
-1.035
-1.46%
jan 1, 1999
74.313
+4.373
6.25%
jan 1, 2000
72.821
-1.492
-2.01%
jan 1, 2001
73.918
+1.098
1.51%
jan 1, 2002
73.147
-0.771
-1.04%
jan 1, 2003
72.932
-0.215
-0.29%
jan 1, 2004
66.942
-5.989
-8.21%
jan 1, 2005
70.482
+3.54
5.29%
jan 1, 2006
78.672
+8.19
11.62%
jan 1, 2007
85.423
+6.752
8.58%
jan 1, 2008
97.512
+12.089
14.15%
jan 1, 2009
105.864
+8.352
8.56%
jan 1, 2010
97.917
-7.947
-7.51%
jan 1, 2011
100.0
+2.083
2.13%
jan 1, 2012
100.086
+0.086
0.09%
jan 1, 2013
96.818
-3.267
-3.26%
jan 1, 2014
97.969
+1.151
1.19%
jan 1, 2015
101.786
+3.817
3.9%
jan 1, 2016
104.878
+3.092
3.04%
Ranking of countries by current statistics by years


Comments: