29
/
en
AIzaSyAYiBZKx7MnpbEhh9jyipgxe19OcubqV5w
April 1, 2024
244168
Solomon Islands
SLB
true
2
1
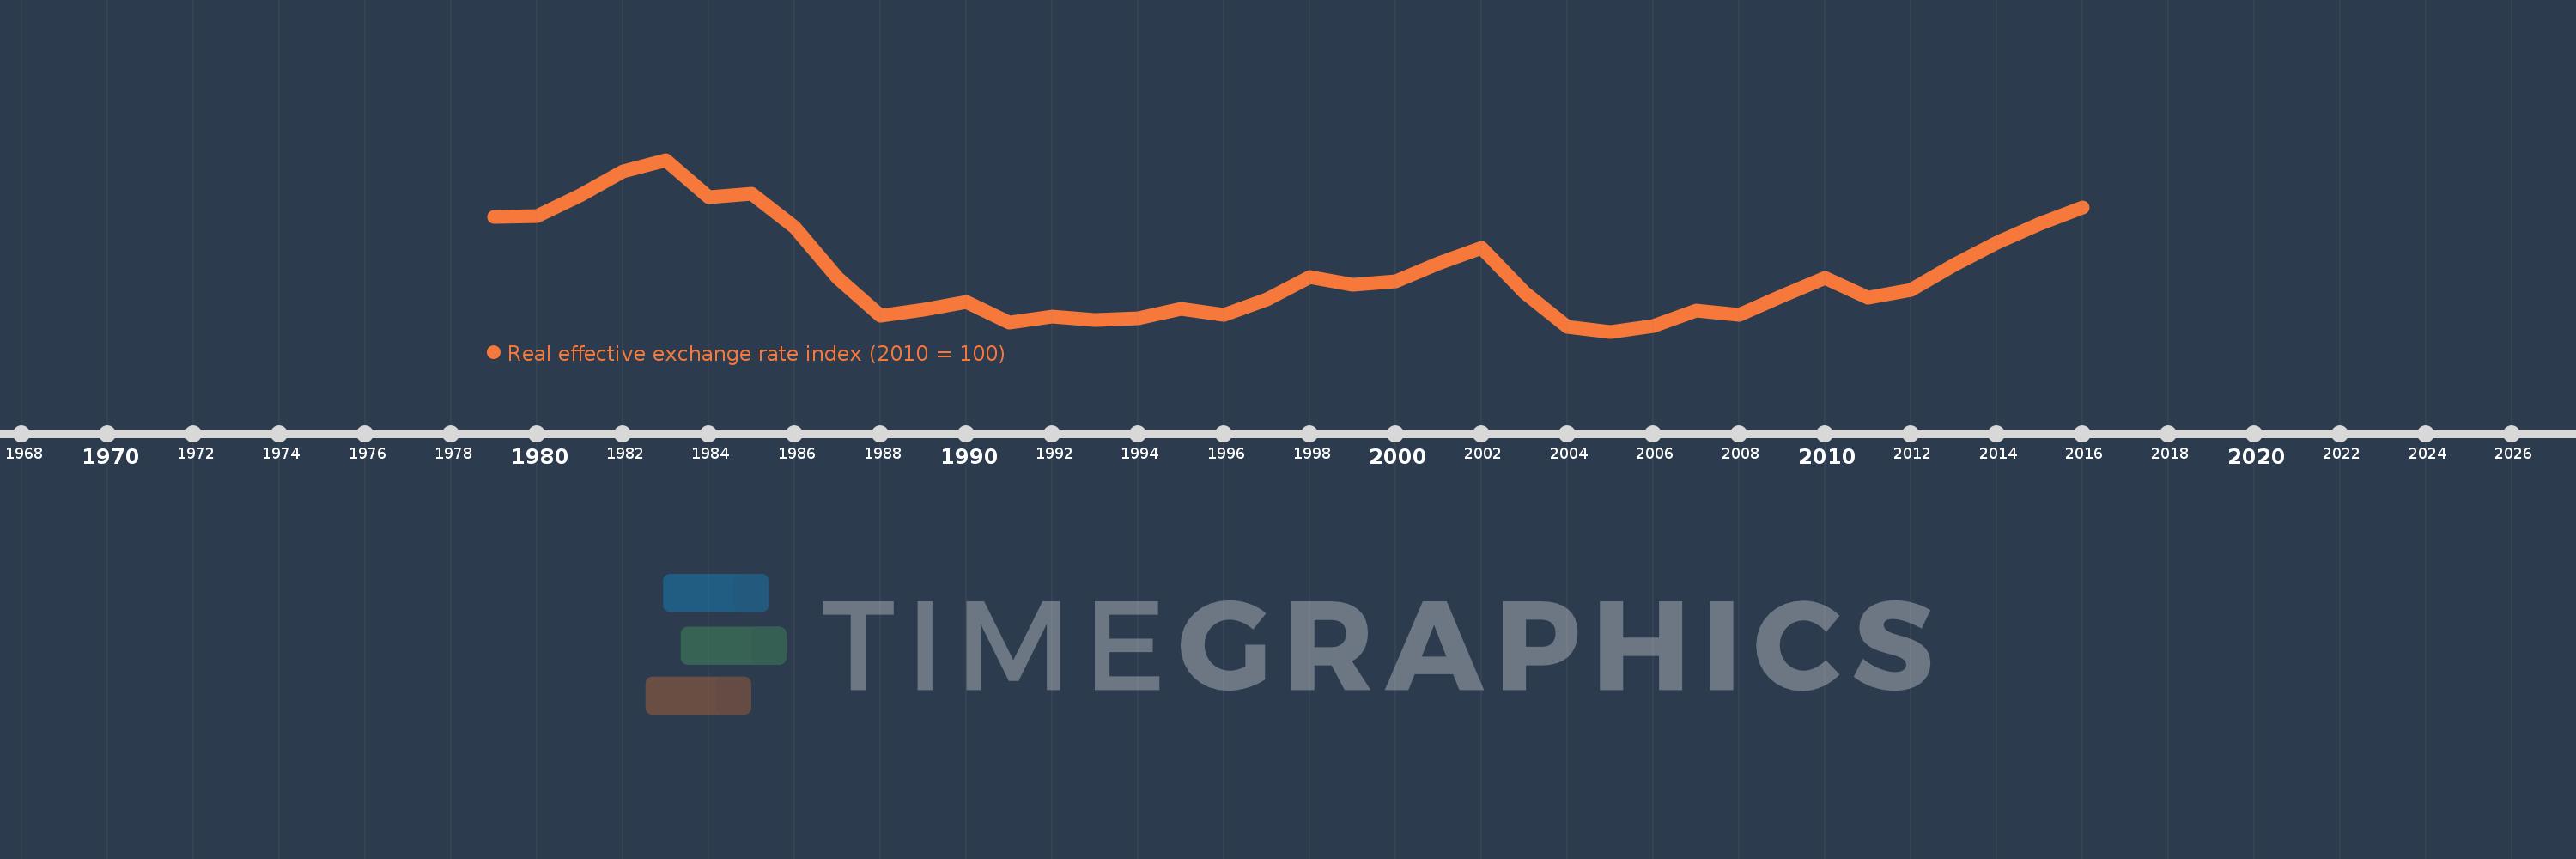
Real effective exchange rate index (2010 = 100)
2016,2015,2014,2013,2012,2011,2010,2009,2008,2007,2006,2005,2004,2003,2002,2001,2000,1999,1998,1997,1996,1995,1994,1993,1992,1991,1990,1989,1988,1987,1986,1985,1984,1983,1982,1981,1980,1979
This statistics in other country:
Timeline:
This timeline shows a graph from 1979 to 2016 of Solomon Islands. No data until 1978. Number of actual observations by date: 38.
Source name:
World Development Indicators
Source organization:
International Monetary Fund, International Financial Statistics.
Categories, topics:
Financial Sector
Last updated:
apr 23, 2017
Indicators value changes by year
Maximum:
152.55
jan 1, 1983
At the date of observation
Value
Absolute change
Change from previous value
jan 1, 1979
130.907
+130.907
0.0%
jan 1, 1980
131.186
+0.279
0.21%
jan 1, 1981
138.915
+7.729
5.89%
jan 1, 1982
148.157
+9.242
6.65%
jan 1, 1983
152.55
+4.394
2.97%
jan 1, 1984
138.271
-14.28
-9.36%
jan 1, 1985
139.596
+1.325
0.96%
jan 1, 1986
126.929
-12.667
-9.07%
jan 1, 1987
107.713
-19.216
-15.14%
jan 1, 1988
93.262
-14.451
-13.42%
jan 1, 1989
95.645
+2.383
2.56%
jan 1, 1990
98.579
+2.933
3.07%
jan 1, 1991
90.508
-8.071
-8.19%
jan 1, 1992
92.895
+2.388
2.64%
jan 1, 1993
91.728
-1.167
-1.26%
jan 1, 1994
92.279
+0.55
0.6%
jan 1, 1995
95.764
+3.485
3.78%
jan 1, 1996
93.555
-2.209
-2.31%
jan 1, 1997
99.525
+5.97
6.38%
jan 1, 1998
107.781
+8.256
8.3%
jan 1, 1999
104.886
-2.895
-2.69%
jan 1, 2000
106.431
+1.545
1.47%
jan 1, 2001
113.248
+6.817
6.41%
jan 1, 2002
118.951
+5.703
5.04%
jan 1, 2003
102.116
-16.835
-14.15%
jan 1, 2004
88.939
-13.176
-12.9%
jan 1, 2005
87.16
-1.779
-2.0%
jan 1, 2006
89.17
+2.01
2.31%
jan 1, 2007
95.265
+6.094
6.83%
jan 1, 2008
93.438
-1.827
-1.92%
jan 1, 2009
100.615
+7.177
7.68%
jan 1, 2010
107.572
+6.957
6.91%
jan 1, 2011
100.0
-7.572
-7.04%
jan 1, 2012
103.083
+3.083
3.08%
jan 1, 2013
112.592
+9.509
9.22%
jan 1, 2014
121.12
+8.528
7.57%
jan 1, 2015
128.141
+7.021
5.8%
jan 1, 2016
134.52
+6.378
4.98%
Ranking of countries by current statistics by years


Comments: