29
/
en
AIzaSyAYiBZKx7MnpbEhh9jyipgxe19OcubqV5w
April 1, 2024
124950
Egypt, Arab Rep.
EGY
true
2
1
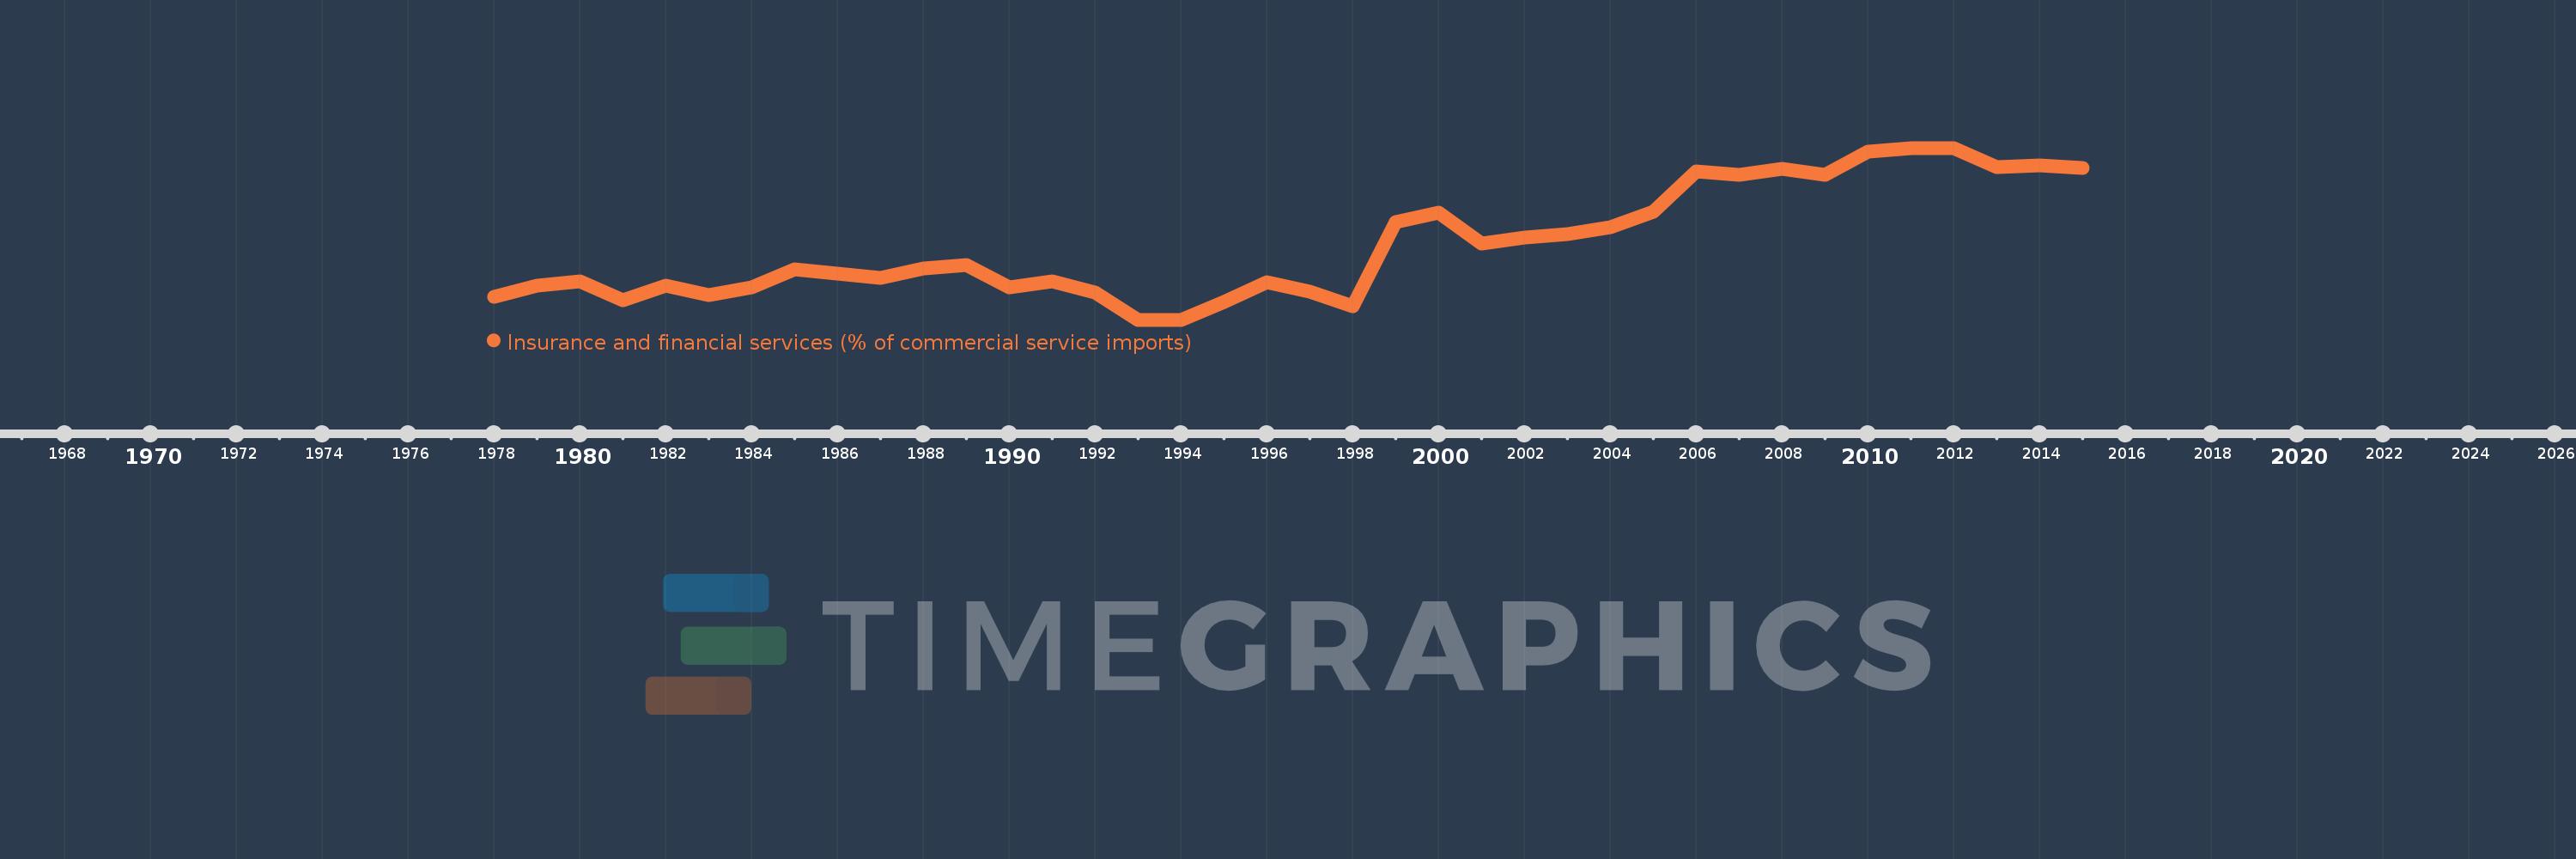
Insurance and financial services (% of commercial service imports)
2015,2014,2013,2012,2011,2010,2009,2008,2007,2006,2005,2004,2003,2002,2001,2000,1999,1998,1997,1996,1995,1994,1993,1992,1991,1990,1989,1988,1987,1986,1985,1984,1983,1982,1981,1980,1979,1978
This statistics in other country:
AfghanistanAlbaniaAlgeriaAngolaAntigua and BarbudaArab WorldArgentinaArmeniaArubaAustraliaAustriaAzerbaijanBahamas, TheBahrainBangladeshBarbadosBelarusBelgiumBelizeBeninBermudaBhutanBoliviaBosnia and HerzegovinaBotswanaBrazilBrunei DarussalamBulgariaBurkina FasoBurundiCabo VerdeCambodiaCameroonCanadaCaribbean small statesCentral African RepublicCentral Europe and the BalticsChadChileChinaColombiaComorosCongo, Dem. Rep.Congo, Rep.Costa RicaCote d'IvoireCroatiaCuracaoCyprusCzech RepublicDenmarkDjiboutiDominicaDominican RepublicEarly-demographic dividendEast Asia & PacificEast Asia & Pacific (excluding high income)East Asia & Pacific (IDA & IBRD countries)EcuadorEgypt, Arab Rep.El SalvadorEquatorial GuineaEritreaEstoniaEthiopiaEuro areaEurope & Central AsiaEurope & Central Asia (excluding high income)Europe & Central Asia (IDA & IBRD countries)European UnionFaroe IslandsFijiFinlandFragile and conflict affected situationsFranceFrench PolynesiaGabonGambia, TheGeorgiaGermanyGhanaGreeceGrenadaGuatemalaGuineaGuinea-BissauGuyanaHaitiHeavily indebted poor countries (HIPC)High incomeHondurasHong Kong SAR, ChinaHungaryIBRD onlyIcelandIDA & IBRD totalIDA onlyIDA totalIndiaIndonesiaIran, Islamic Rep.IraqIrelandIsraelItalyJamaicaJapanJordanKazakhstanKenyaKiribatiKorea, Rep.KosovoKuwaitKyrgyz RepublicLao PDRLate-demographic dividendLatin America & Caribbean Latin America & Caribbean (excluding high income)Latin America & the Caribbean (IDA & IBRD countries)LatviaLeast developed countries: UN classificationLebanonLesothoLiberiaLibyaLithuaniaLow & middle incomeLow incomeLower middle incomeLuxembourgMacao SAR, ChinaMacedonia, FYRMadagascarMalawiMalaysiaMaldivesMaliMaltaMarshall IslandsMauritaniaMauritiusMexicoMicronesia, Fed. Sts.Middle East & North AfricaMiddle East & North Africa (excluding high income)Middle East & North Africa (IDA & IBRD countries)Middle incomeMoldovaMongoliaMontenegroMoroccoMozambiqueMyanmarNamibiaNepalNetherlandsNew CaledoniaNew ZealandNicaraguaNigerNigeriaNorth AmericaNorwayOECD membersOmanOther small statesPacific island small statesPakistanPalauPanamaPapua New GuineaParaguayPeruPhilippinesPolandPortugalPost-demographic dividendPre-demographic dividendQatarRomaniaRussian FederationRwandaSamoaSao Tome and PrincipeSaudi ArabiaSenegalSerbiaSeychellesSierra LeoneSingaporeSint Maarten (Dutch part)Slovak RepublicSloveniaSmall statesSolomon IslandsSouth AfricaSouth AsiaSouth Asia (IDA & IBRD)South SudanSpainSri LankaSt. Kitts and NevisSt. LuciaSt. Vincent and the GrenadinesSub-Saharan Africa Sub-Saharan Africa (excluding high income)Sub-Saharan Africa (IDA & IBRD countries)SudanSurinameSwazilandSwedenSwitzerlandSyrian Arab RepublicTajikistanTanzaniaThailandTimor-LesteTogoTongaTrinidad and TobagoTunisiaTurkeyTuvaluUgandaUkraineUnited KingdomUnited StatesUpper middle incomeUruguayVanuatuVenezuela, RBWest Bank and GazaWorldYemen, Rep.ZambiaZimbabwe Timeline:
This timeline shows a graph from 1978 to 2015 of Egypt, Arab Rep.. No data until 1977. Number of actual observations by date: 38.
Source name:
World Development Indicators
Source organization:
International Monetary Fund, Balance of Payments Statistics Yearbook and data files.
Categories, topics:
Private Sector, Trade
Last updated:
apr 23, 2017
Indicators value changes by year
Maximum:
11.519
jan 1, 2012
At the date of observation
Value
Absolute change
Change from previous value
jan 1, 1978
3.835
+3.835
0.0%
jan 1, 1979
4.446
+0.611
15.93%
jan 1, 1980
4.648
+0.201
4.52%
jan 1, 1981
3.686
-0.962
-20.69%
jan 1, 1982
4.413
+0.727
19.72%
jan 1, 1983
3.943
-0.47
-10.64%
jan 1, 1984
4.339
+0.395
10.02%
jan 1, 1985
5.275
+0.937
21.59%
jan 1, 1986
5.059
-0.216
-4.1%
jan 1, 1987
4.837
-0.222
-4.39%
jan 1, 1988
5.305
+0.468
9.68%
jan 1, 1989
5.487
+0.182
3.43%
jan 1, 1990
4.328
-1.159
-21.12%
jan 1, 1991
4.645
+0.316
7.3%
jan 1, 1992
4.069
-0.575
-12.38%
jan 1, 1993
2.669
-1.4
-34.41%
jan 1, 1994
2.672
+0.003
0.13%
jan 1, 1995
3.567
+0.895
33.49%
jan 1, 1996
4.611
+1.044
29.25%
jan 1, 1997
4.12
-0.491
-10.65%
jan 1, 1998
3.361
-0.759
-18.41%
jan 1, 1999
7.713
+4.352
129.48%
jan 1, 2000
8.173
+0.46
5.96%
jan 1, 2001
6.577
-1.596
-19.52%
jan 1, 2002
6.899
+0.321
4.89%
jan 1, 2003
7.094
+0.196
2.84%
jan 1, 2004
7.427
+0.332
4.69%
jan 1, 2005
8.236
+0.809
10.89%
jan 1, 2006
10.297
+2.061
25.03%
jan 1, 2007
10.154
-0.143
-1.39%
jan 1, 2008
10.445
+0.291
2.86%
jan 1, 2009
10.135
-0.31
-2.97%
jan 1, 2010
11.32
+1.185
11.69%
jan 1, 2011
11.492
+0.172
1.52%
jan 1, 2012
11.519
+0.027
0.23%
jan 1, 2013
10.514
-1.005
-8.73%
jan 1, 2014
10.626
+0.113
1.07%
jan 1, 2015
10.48
-0.146
-1.37%
Ranking of countries by current statistics by years


Comments: