29
/
en
AIzaSyAYiBZKx7MnpbEhh9jyipgxe19OcubqV5w
April 1, 2024
79591
Barbados
BRB
true
2
1
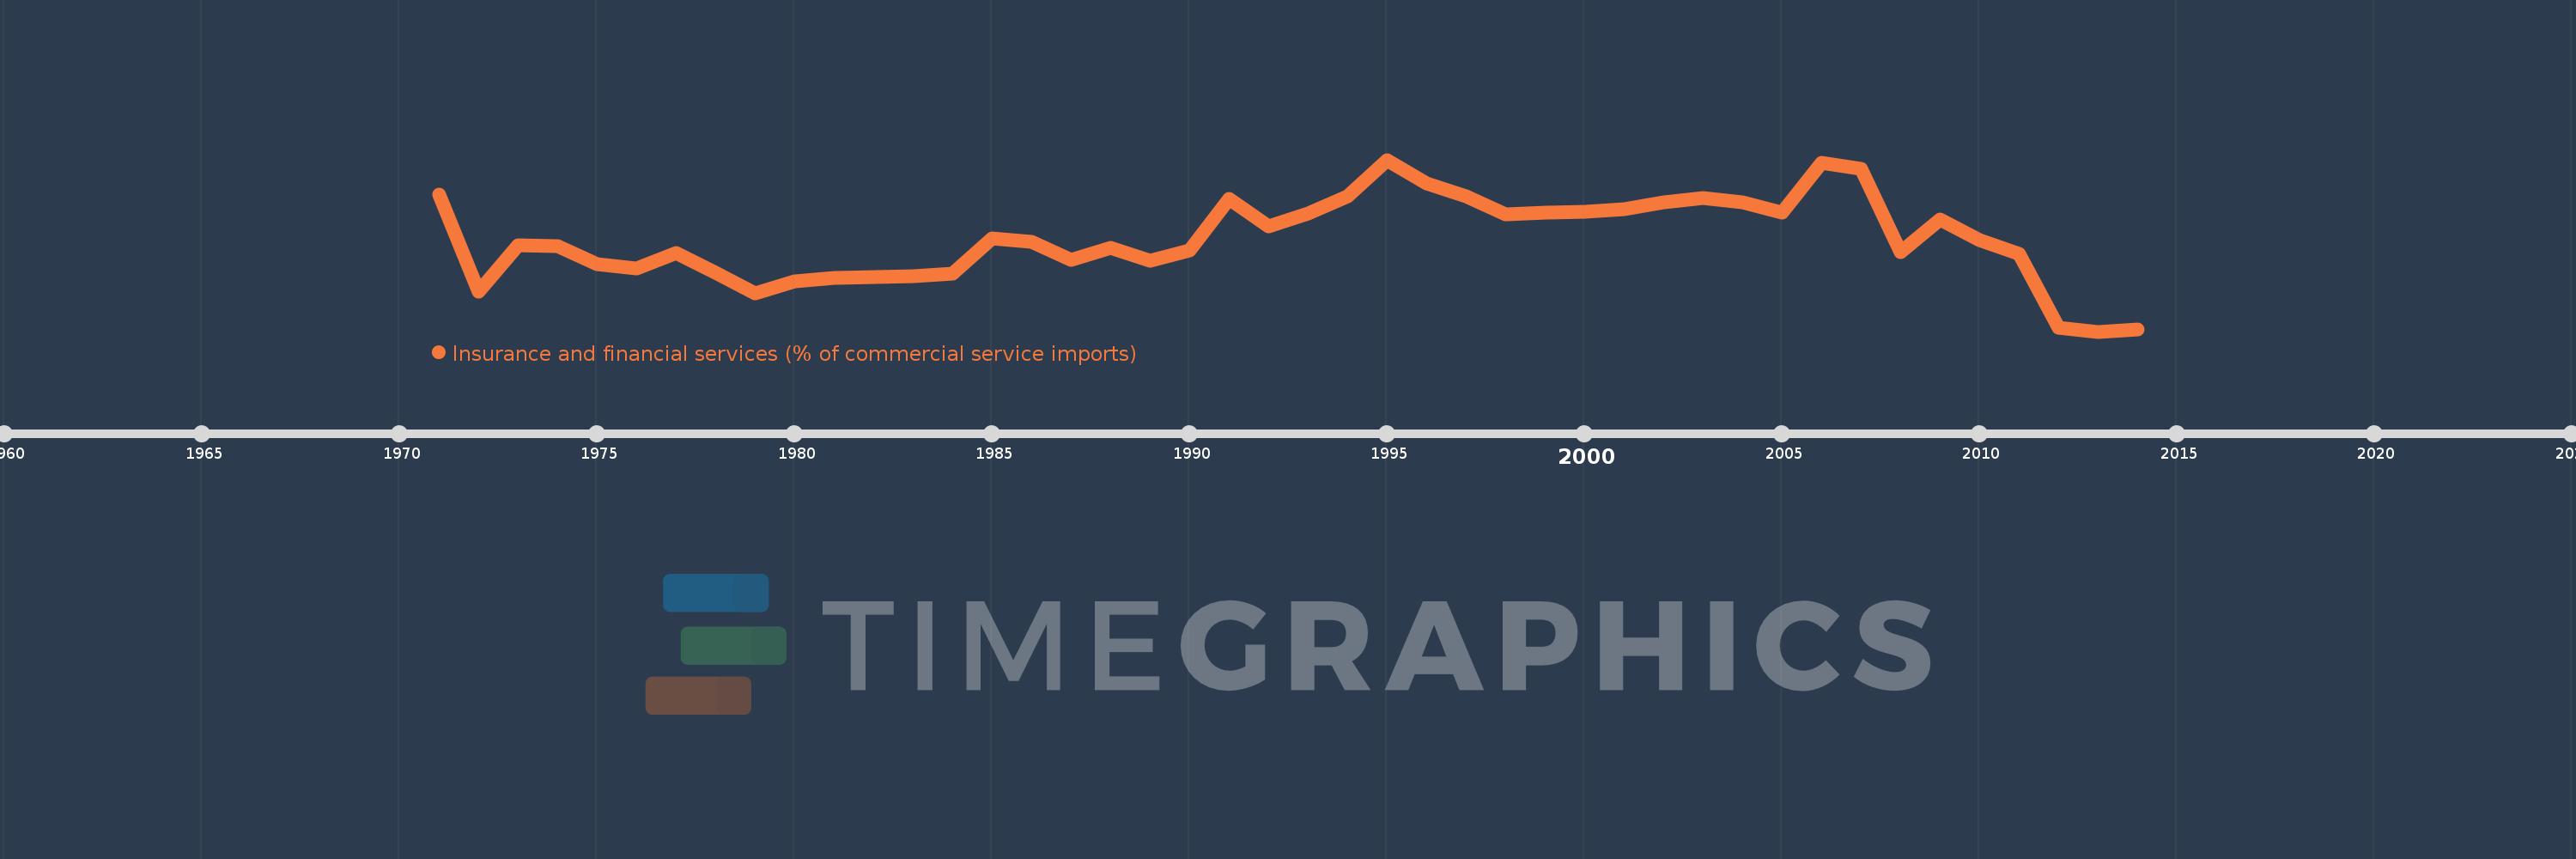
Insurance and financial services (% of commercial service imports)
2014,2013,2012,2011,2010,2009,2008,2007,2006,2005,2004,2003,2002,2001,2000,1999,1998,1997,1996,1995,1994,1993,1992,1991,1990,1989,1988,1987,1986,1985,1984,1983,1982,1981,1980,1979,1978,1977,1976,1975,1974,1973,1972,1971
This statistics in other country:
AfghanistanAlbaniaAlgeriaAngolaAntigua and BarbudaArab WorldArgentinaArmeniaArubaAustraliaAustriaAzerbaijanBahamas, TheBahrainBangladeshBarbadosBelarusBelgiumBelizeBeninBermudaBhutanBoliviaBosnia and HerzegovinaBotswanaBrazilBrunei DarussalamBulgariaBurkina FasoBurundiCabo VerdeCambodiaCameroonCanadaCaribbean small statesCentral African RepublicCentral Europe and the BalticsChadChileChinaColombiaComorosCongo, Dem. Rep.Congo, Rep.Costa RicaCote d'IvoireCroatiaCuracaoCyprusCzech RepublicDenmarkDjiboutiDominicaDominican RepublicEarly-demographic dividendEast Asia & PacificEast Asia & Pacific (excluding high income)East Asia & Pacific (IDA & IBRD countries)EcuadorEgypt, Arab Rep.El SalvadorEquatorial GuineaEritreaEstoniaEthiopiaEuro areaEurope & Central AsiaEurope & Central Asia (excluding high income)Europe & Central Asia (IDA & IBRD countries)European UnionFaroe IslandsFijiFinlandFragile and conflict affected situationsFranceFrench PolynesiaGabonGambia, TheGeorgiaGermanyGhanaGreeceGrenadaGuatemalaGuineaGuinea-BissauGuyanaHaitiHeavily indebted poor countries (HIPC)High incomeHondurasHong Kong SAR, ChinaHungaryIBRD onlyIcelandIDA & IBRD totalIDA onlyIDA totalIndiaIndonesiaIran, Islamic Rep.IraqIrelandIsraelItalyJamaicaJapanJordanKazakhstanKenyaKiribatiKorea, Rep.KosovoKuwaitKyrgyz RepublicLao PDRLate-demographic dividendLatin America & Caribbean Latin America & Caribbean (excluding high income)Latin America & the Caribbean (IDA & IBRD countries)LatviaLeast developed countries: UN classificationLebanonLesothoLiberiaLibyaLithuaniaLow & middle incomeLow incomeLower middle incomeLuxembourgMacao SAR, ChinaMacedonia, FYRMadagascarMalawiMalaysiaMaldivesMaliMaltaMarshall IslandsMauritaniaMauritiusMexicoMicronesia, Fed. Sts.Middle East & North AfricaMiddle East & North Africa (excluding high income)Middle East & North Africa (IDA & IBRD countries)Middle incomeMoldovaMongoliaMontenegroMoroccoMozambiqueMyanmarNamibiaNepalNetherlandsNew CaledoniaNew ZealandNicaraguaNigerNigeriaNorth AmericaNorwayOECD membersOmanOther small statesPacific island small statesPakistanPalauPanamaPapua New GuineaParaguayPeruPhilippinesPolandPortugalPost-demographic dividendPre-demographic dividendQatarRomaniaRussian FederationRwandaSamoaSao Tome and PrincipeSaudi ArabiaSenegalSerbiaSeychellesSierra LeoneSingaporeSint Maarten (Dutch part)Slovak RepublicSloveniaSmall statesSolomon IslandsSouth AfricaSouth AsiaSouth Asia (IDA & IBRD)South SudanSpainSri LankaSt. Kitts and NevisSt. LuciaSt. Vincent and the GrenadinesSub-Saharan Africa Sub-Saharan Africa (excluding high income)Sub-Saharan Africa (IDA & IBRD countries)SudanSurinameSwazilandSwedenSwitzerlandSyrian Arab RepublicTajikistanTanzaniaThailandTimor-LesteTogoTongaTrinidad and TobagoTunisiaTurkeyTuvaluUgandaUkraineUnited KingdomUnited StatesUpper middle incomeUruguayVanuatuVenezuela, RBWest Bank and GazaWorldYemen, Rep.ZambiaZimbabwe Timeline:
This timeline shows a graph from 1971 to 2014 of Barbados. No data until 1970. Number of actual observations by date: 44.
Source name:
World Development Indicators
Source organization:
International Monetary Fund, Balance of Payments Statistics Yearbook and data files.
Categories, topics:
Private Sector, Trade
Last updated:
apr 23, 2017
Indicators value changes by year
Maximum:
32.966
jan 1, 1995
At the date of observation
Value
Absolute change
Change from previous value
jan 1, 1971
27.314
+27.314
0.0%
jan 1, 1972
11.478
-15.836
-57.98%
jan 1, 1973
19.062
+7.584
66.07%
jan 1, 1974
18.949
-0.113
-0.59%
jan 1, 1975
16.052
-2.897
-15.29%
jan 1, 1976
15.279
-0.773
-4.82%
jan 1, 1977
17.758
+2.479
16.22%
jan 1, 1978
14.589
-3.169
-17.85%
jan 1, 1979
11.172
-3.416
-23.42%
jan 1, 1980
13.148
+1.975
17.68%
jan 1, 1981
13.785
+0.637
4.84%
jan 1, 1982
13.836
+0.051
0.37%
jan 1, 1983
14.02
+0.184
1.33%
jan 1, 1984
14.478
+0.459
3.27%
jan 1, 1985
20.232
+5.754
39.74%
jan 1, 1986
19.667
-0.565
-2.79%
jan 1, 1987
16.676
-2.991
-15.21%
jan 1, 1988
18.689
+2.013
12.07%
jan 1, 1989
16.592
-2.097
-11.22%
jan 1, 1990
18.284
+1.692
10.2%
jan 1, 1991
26.643
+8.359
45.72%
jan 1, 1992
22.105
-4.538
-17.03%
jan 1, 1993
24.183
+2.078
9.4%
jan 1, 1994
27.017
+2.834
11.72%
jan 1, 1995
32.966
+5.948
22.02%
jan 1, 1996
29.08
-3.886
-11.79%
jan 1, 1997
27.01
-2.07
-7.12%
jan 1, 1998
24.136
-2.874
-10.64%
jan 1, 1999
24.417
+0.281
1.17%
jan 1, 2000
24.576
+0.159
0.65%
jan 1, 2001
24.902
+0.327
1.33%
jan 1, 2002
26.03
+1.128
4.53%
jan 1, 2003
26.814
+0.784
3.01%
jan 1, 2004
26.077
-0.737
-2.75%
jan 1, 2005
24.4
-1.677
-6.43%
jan 1, 2006
32.521
+8.121
33.28%
jan 1, 2007
31.468
-1.053
-3.24%
jan 1, 2008
17.945
-13.523
-42.97%
jan 1, 2009
23.298
+5.352
29.83%
jan 1, 2010
19.949
-3.349
-14.38%
jan 1, 2011
17.703
-2.246
-11.26%
jan 1, 2012
5.624
-12.079
-68.23%
jan 1, 2013
5.019
-0.605
-10.76%
jan 1, 2014
5.361
+0.342
6.81%
Ranking of countries by current statistics by years


Comments: