29
/
en
AIzaSyAYiBZKx7MnpbEhh9jyipgxe19OcubqV5w
April 1, 2024
51018
Middle income
MIC
false
2
1
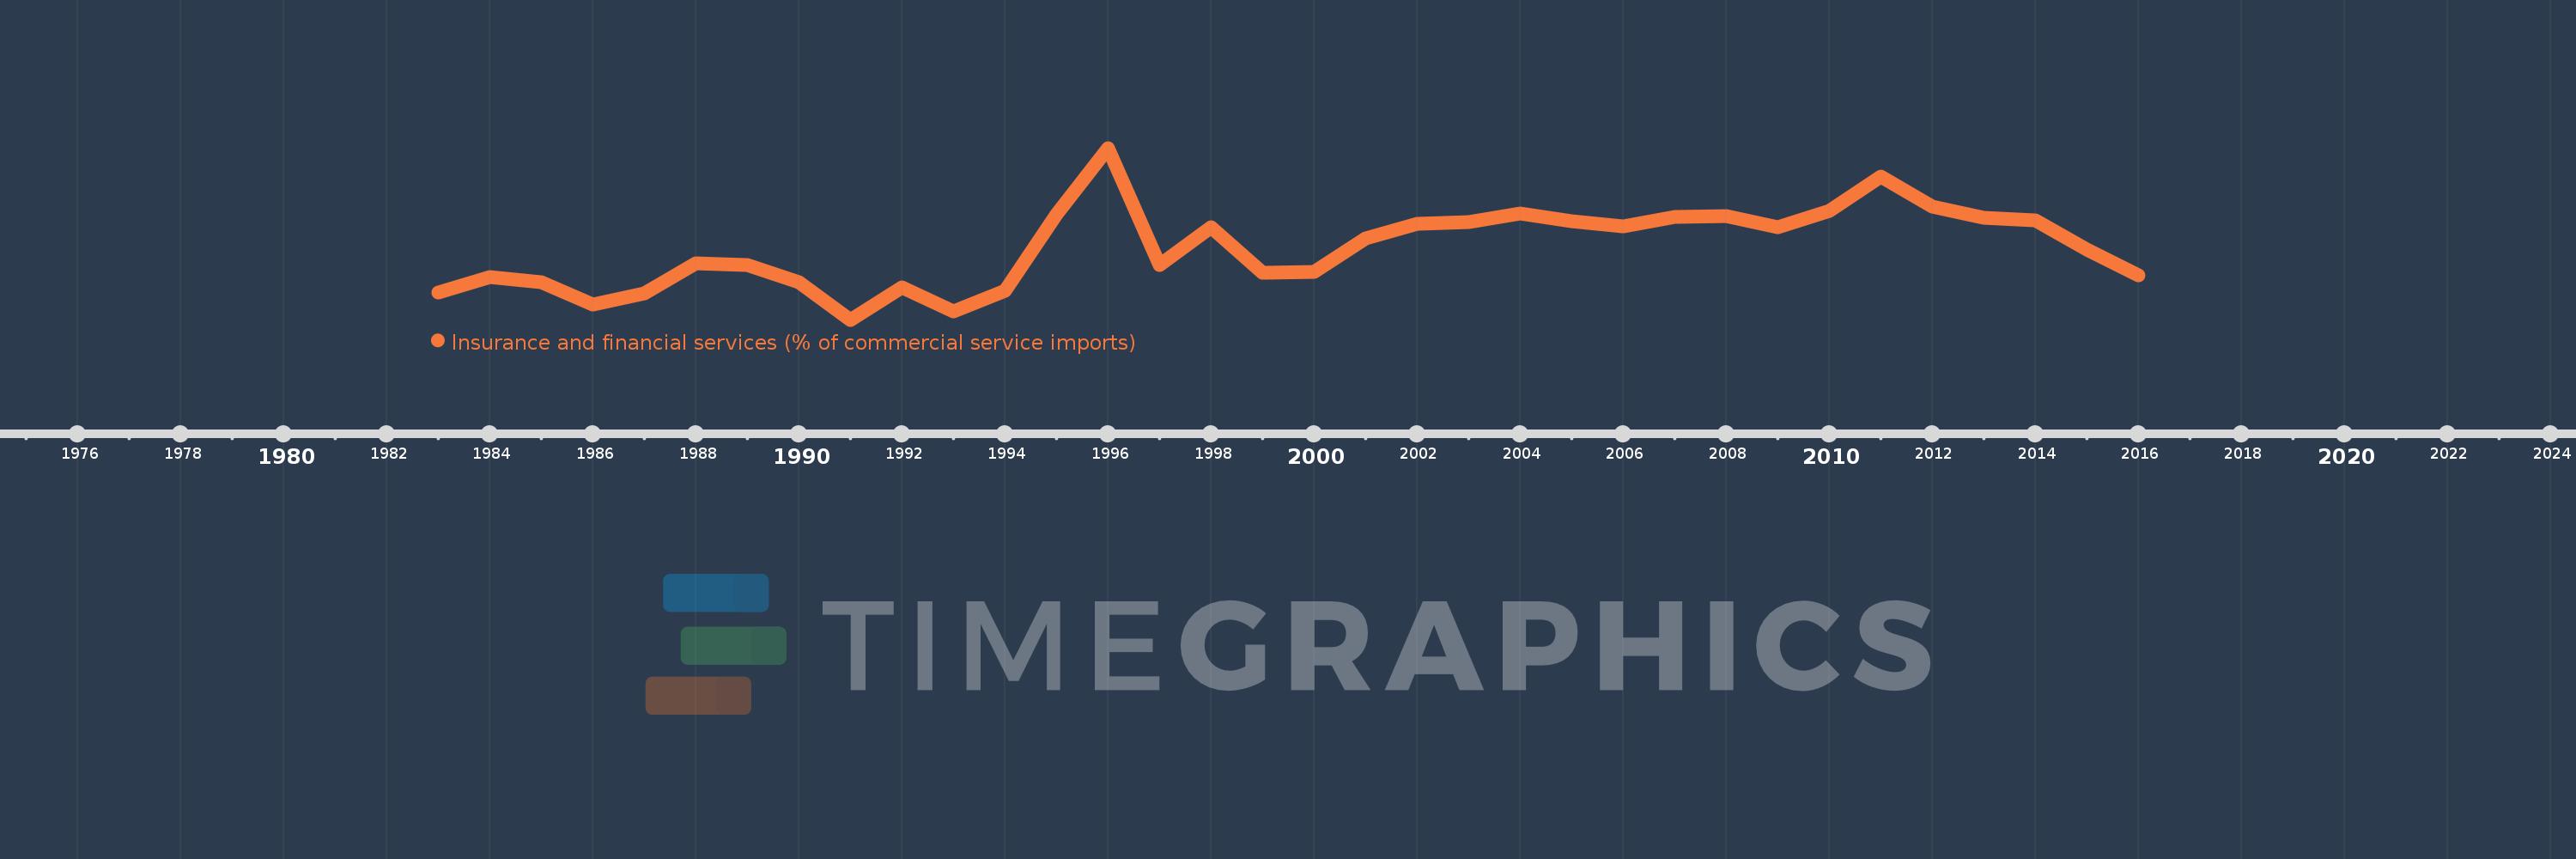
Insurance and financial services (% of commercial service imports)
2016,2015,2014,2013,2012,2011,2010,2009,2008,2007,2006,2005,2004,2003,2002,2001,2000,1999,1998,1997,1996,1995,1994,1993,1992,1991,1990,1989,1988,1987,1986,1985,1984,1983
This statistics in other country:
AfghanistanAlbaniaAlgeriaAngolaAntigua and BarbudaArab WorldArgentinaArmeniaArubaAustraliaAustriaAzerbaijanBahamas, TheBahrainBangladeshBarbadosBelarusBelgiumBelizeBeninBermudaBhutanBoliviaBosnia and HerzegovinaBotswanaBrazilBrunei DarussalamBulgariaBurkina FasoBurundiCabo VerdeCambodiaCameroonCanadaCaribbean small statesCentral African RepublicCentral Europe and the BalticsChadChileChinaColombiaComorosCongo, Dem. Rep.Congo, Rep.Costa RicaCote d'IvoireCroatiaCuracaoCyprusCzech RepublicDenmarkDjiboutiDominicaDominican RepublicEarly-demographic dividendEast Asia & PacificEast Asia & Pacific (excluding high income)East Asia & Pacific (IDA & IBRD countries)EcuadorEgypt, Arab Rep.El SalvadorEquatorial GuineaEritreaEstoniaEthiopiaEuro areaEurope & Central AsiaEurope & Central Asia (excluding high income)Europe & Central Asia (IDA & IBRD countries)European UnionFaroe IslandsFijiFinlandFragile and conflict affected situationsFranceFrench PolynesiaGabonGambia, TheGeorgiaGermanyGhanaGreeceGrenadaGuatemalaGuineaGuinea-BissauGuyanaHaitiHeavily indebted poor countries (HIPC)High incomeHondurasHong Kong SAR, ChinaHungaryIBRD onlyIcelandIDA & IBRD totalIDA onlyIDA totalIndiaIndonesiaIran, Islamic Rep.IraqIrelandIsraelItalyJamaicaJapanJordanKazakhstanKenyaKiribatiKorea, Rep.KosovoKuwaitKyrgyz RepublicLao PDRLate-demographic dividendLatin America & Caribbean Latin America & Caribbean (excluding high income)Latin America & the Caribbean (IDA & IBRD countries)LatviaLeast developed countries: UN classificationLebanonLesothoLiberiaLibyaLithuaniaLow & middle incomeLow incomeLower middle incomeLuxembourgMacao SAR, ChinaMacedonia, FYRMadagascarMalawiMalaysiaMaldivesMaliMaltaMarshall IslandsMauritaniaMauritiusMexicoMicronesia, Fed. Sts.Middle East & North AfricaMiddle East & North Africa (excluding high income)Middle East & North Africa (IDA & IBRD countries)Middle incomeMoldovaMongoliaMontenegroMoroccoMozambiqueMyanmarNamibiaNepalNetherlandsNew CaledoniaNew ZealandNicaraguaNigerNigeriaNorth AmericaNorwayOECD membersOmanOther small statesPacific island small statesPakistanPalauPanamaPapua New GuineaParaguayPeruPhilippinesPolandPortugalPost-demographic dividendPre-demographic dividendQatarRomaniaRussian FederationRwandaSamoaSao Tome and PrincipeSaudi ArabiaSenegalSerbiaSeychellesSierra LeoneSingaporeSint Maarten (Dutch part)Slovak RepublicSloveniaSmall statesSolomon IslandsSouth AfricaSouth AsiaSouth Asia (IDA & IBRD)South SudanSpainSri LankaSt. Kitts and NevisSt. LuciaSt. Vincent and the GrenadinesSub-Saharan Africa Sub-Saharan Africa (excluding high income)Sub-Saharan Africa (IDA & IBRD countries)SudanSurinameSwazilandSwedenSwitzerlandSyrian Arab RepublicTajikistanTanzaniaThailandTimor-LesteTogoTongaTrinidad and TobagoTunisiaTurkeyTuvaluUgandaUkraineUnited KingdomUnited StatesUpper middle incomeUruguayVanuatuVenezuela, RBWest Bank and GazaWorldYemen, Rep.ZambiaZimbabwe Timeline:
This timeline shows a graph from 1983 to 2016 of Middle income. No data until 1982. Number of actual observations by date: 34.
Source name:
World Development Indicators
Source organization:
International Monetary Fund, Balance of Payments Statistics Yearbook and data files.
Categories, topics:
Private Sector, Trade
Last updated:
apr 23, 2017
Indicators value changes by year
Maximum:
10.358
jan 1, 1996
At the date of observation
Value
Absolute change
Change from previous value
jan 1, 1983
5.468
+5.468
0.0%
jan 1, 1984
6.014
+0.546
9.99%
jan 1, 1985
5.838
-0.176
-2.93%
jan 1, 1986
5.061
-0.777
-13.31%
jan 1, 1987
5.45
+0.389
7.69%
jan 1, 1988
6.456
+1.006
18.46%
jan 1, 1989
6.413
-0.043
-0.66%
jan 1, 1990
5.822
-0.591
-9.21%
jan 1, 1991
4.559
-1.263
-21.69%
jan 1, 1992
5.659
+1.099
24.1%
jan 1, 1993
4.838
-0.821
-14.5%
jan 1, 1994
5.544
+0.706
14.6%
jan 1, 1995
8.131
+2.587
46.65%
jan 1, 1996
10.358
+2.227
27.39%
jan 1, 1997
6.397
-3.961
-38.24%
jan 1, 1998
7.69
+1.293
20.21%
jan 1, 1999
6.143
-1.547
-20.12%
jan 1, 2000
6.177
+0.034
0.56%
jan 1, 2001
7.314
+1.137
18.4%
jan 1, 2002
7.807
+0.494
6.75%
jan 1, 2003
7.844
+0.036
0.46%
jan 1, 2004
8.155
+0.312
3.97%
jan 1, 2005
7.885
-0.27
-3.31%
jan 1, 2006
7.714
-0.171
-2.17%
jan 1, 2007
8.039
+0.325
4.22%
jan 1, 2008
8.049
+0.01
0.13%
jan 1, 2009
7.694
-0.355
-4.41%
jan 1, 2010
8.233
+0.539
7.01%
jan 1, 2011
9.387
+1.153
14.01%
jan 1, 2012
8.39
-0.996
-10.62%
jan 1, 2013
8.008
-0.382
-4.55%
jan 1, 2014
7.906
-0.102
-1.28%
jan 1, 2015
6.919
-0.987
-12.49%
jan 1, 2016
6.065
-0.854
-12.35%
Ranking of countries by current statistics by years


Comments: