29
/
en
AIzaSyAYiBZKx7MnpbEhh9jyipgxe19OcubqV5w
April 1, 2024
54886
Post-demographic dividend
PST
false
2
1
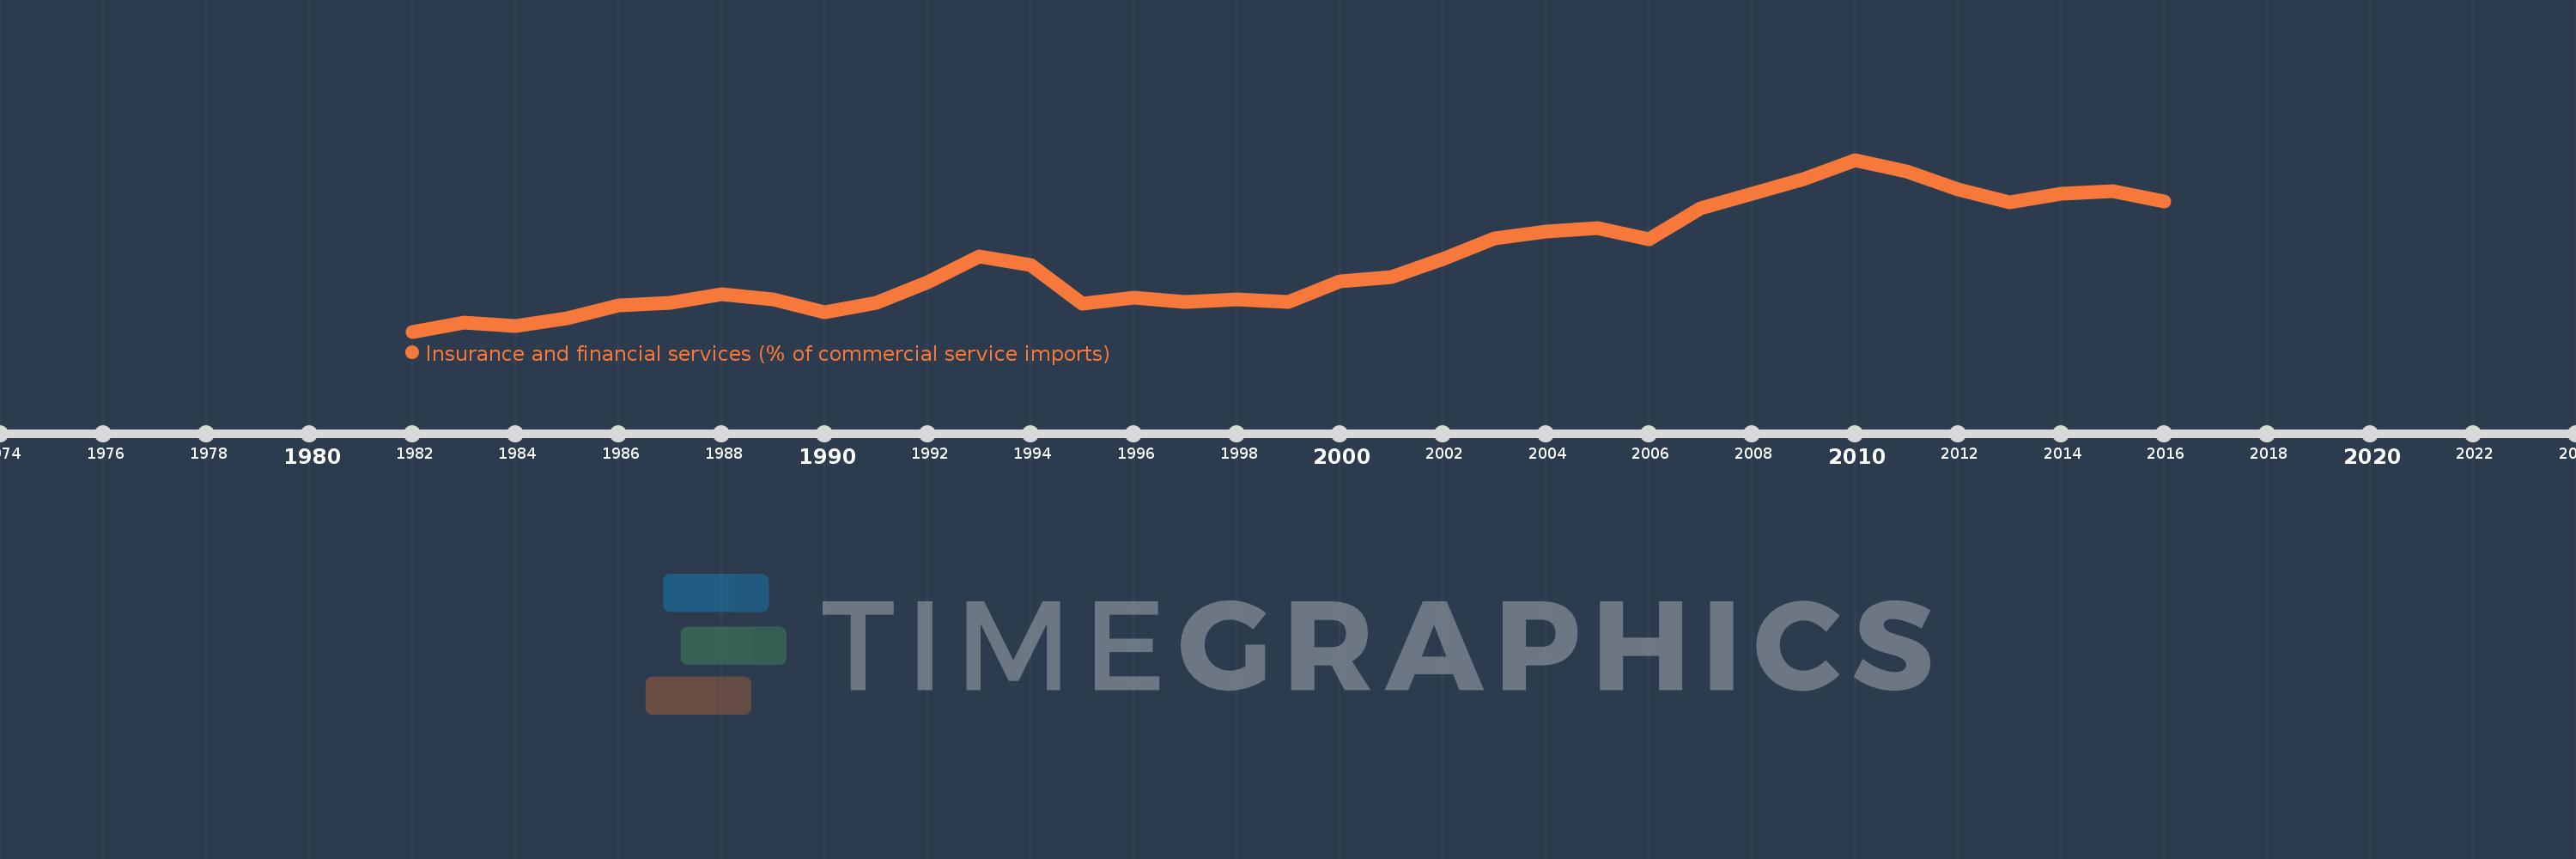
Insurance and financial services (% of commercial service imports)
2016,2015,2014,2013,2012,2011,2010,2009,2008,2007,2006,2005,2004,2003,2002,2001,2000,1999,1998,1997,1996,1995,1994,1993,1992,1991,1990,1989,1988,1987,1986,1985,1984,1983,1982
This statistics in other country:
AfghanistanAlbaniaAlgeriaAngolaAntigua and BarbudaArab WorldArgentinaArmeniaArubaAustraliaAustriaAzerbaijanBahamas, TheBahrainBangladeshBarbadosBelarusBelgiumBelizeBeninBermudaBhutanBoliviaBosnia and HerzegovinaBotswanaBrazilBrunei DarussalamBulgariaBurkina FasoBurundiCabo VerdeCambodiaCameroonCanadaCaribbean small statesCentral African RepublicCentral Europe and the BalticsChadChileChinaColombiaComorosCongo, Dem. Rep.Congo, Rep.Costa RicaCote d'IvoireCroatiaCuracaoCyprusCzech RepublicDenmarkDjiboutiDominicaDominican RepublicEarly-demographic dividendEast Asia & PacificEast Asia & Pacific (excluding high income)East Asia & Pacific (IDA & IBRD countries)EcuadorEgypt, Arab Rep.El SalvadorEquatorial GuineaEritreaEstoniaEthiopiaEuro areaEurope & Central AsiaEurope & Central Asia (excluding high income)Europe & Central Asia (IDA & IBRD countries)European UnionFaroe IslandsFijiFinlandFragile and conflict affected situationsFranceFrench PolynesiaGabonGambia, TheGeorgiaGermanyGhanaGreeceGrenadaGuatemalaGuineaGuinea-BissauGuyanaHaitiHeavily indebted poor countries (HIPC)High incomeHondurasHong Kong SAR, ChinaHungaryIBRD onlyIcelandIDA & IBRD totalIDA onlyIDA totalIndiaIndonesiaIran, Islamic Rep.IraqIrelandIsraelItalyJamaicaJapanJordanKazakhstanKenyaKiribatiKorea, Rep.KosovoKuwaitKyrgyz RepublicLao PDRLate-demographic dividendLatin America & Caribbean Latin America & Caribbean (excluding high income)Latin America & the Caribbean (IDA & IBRD countries)LatviaLeast developed countries: UN classificationLebanonLesothoLiberiaLibyaLithuaniaLow & middle incomeLow incomeLower middle incomeLuxembourgMacao SAR, ChinaMacedonia, FYRMadagascarMalawiMalaysiaMaldivesMaliMaltaMarshall IslandsMauritaniaMauritiusMexicoMicronesia, Fed. Sts.Middle East & North AfricaMiddle East & North Africa (excluding high income)Middle East & North Africa (IDA & IBRD countries)Middle incomeMoldovaMongoliaMontenegroMoroccoMozambiqueMyanmarNamibiaNepalNetherlandsNew CaledoniaNew ZealandNicaraguaNigerNigeriaNorth AmericaNorwayOECD membersOmanOther small statesPacific island small statesPakistanPalauPanamaPapua New GuineaParaguayPeruPhilippinesPolandPortugalPost-demographic dividendPre-demographic dividendQatarRomaniaRussian FederationRwandaSamoaSao Tome and PrincipeSaudi ArabiaSenegalSerbiaSeychellesSierra LeoneSingaporeSint Maarten (Dutch part)Slovak RepublicSloveniaSmall statesSolomon IslandsSouth AfricaSouth AsiaSouth Asia (IDA & IBRD)South SudanSpainSri LankaSt. Kitts and NevisSt. LuciaSt. Vincent and the GrenadinesSub-Saharan Africa Sub-Saharan Africa (excluding high income)Sub-Saharan Africa (IDA & IBRD countries)SudanSurinameSwazilandSwedenSwitzerlandSyrian Arab RepublicTajikistanTanzaniaThailandTimor-LesteTogoTongaTrinidad and TobagoTunisiaTurkeyTuvaluUgandaUkraineUnited KingdomUnited StatesUpper middle incomeUruguayVanuatuVenezuela, RBWest Bank and GazaWorldYemen, Rep.ZambiaZimbabwe Timeline:
This timeline shows a graph from 1982 to 2016 of Post-demographic dividend. No data until 1981. Number of actual observations by date: 35.
Source name:
World Development Indicators
Source organization:
International Monetary Fund, Balance of Payments Statistics Yearbook and data files.
Categories, topics:
Private Sector, Trade
Last updated:
apr 23, 2017
Indicators value changes by year
Maximum:
10.073
jan 1, 2010
At the date of observation
Value
Absolute change
Change from previous value
jan 1, 1982
4.148
+4.148
0.0%
jan 1, 1983
4.448
+0.3
7.24%
jan 1, 1984
4.351
-0.098
-2.2%
jan 1, 1985
4.62
+0.269
6.19%
jan 1, 1986
5.052
+0.432
9.34%
jan 1, 1987
5.135
+0.083
1.65%
jan 1, 1988
5.443
+0.308
5.99%
jan 1, 1989
5.249
-0.193
-3.55%
jan 1, 1990
4.806
-0.443
-8.45%
jan 1, 1991
5.151
+0.345
7.18%
jan 1, 1992
5.842
+0.691
13.41%
jan 1, 1993
6.73
+0.888
15.21%
jan 1, 1994
6.433
-0.297
-4.41%
jan 1, 1995
5.12
-1.313
-20.41%
jan 1, 1996
5.332
+0.212
4.14%
jan 1, 1997
5.164
-0.167
-3.14%
jan 1, 1998
5.246
+0.082
1.58%
jan 1, 1999
5.175
-0.071
-1.35%
jan 1, 2000
5.88
+0.705
13.63%
jan 1, 2001
6.027
+0.147
2.49%
jan 1, 2002
6.654
+0.627
10.41%
jan 1, 2003
7.367
+0.713
10.72%
jan 1, 2004
7.586
+0.219
2.97%
jan 1, 2005
7.709
+0.123
1.63%
jan 1, 2006
7.342
-0.368
-4.77%
jan 1, 2007
8.407
+1.066
14.52%
jan 1, 2008
8.891
+0.483
5.75%
jan 1, 2009
9.404
+0.514
5.78%
jan 1, 2010
10.073
+0.669
7.11%
jan 1, 2011
9.67
-0.403
-4.0%
jan 1, 2012
9.064
-0.606
-6.26%
jan 1, 2013
8.599
-0.466
-5.14%
jan 1, 2014
8.913
+0.314
3.65%
jan 1, 2015
9.0
+0.087
0.98%
jan 1, 2016
8.625
-0.375
-4.17%
Ranking of countries by current statistics by years


Comments: