29
/
en
AIzaSyAYiBZKx7MnpbEhh9jyipgxe19OcubqV5w
April 1, 2024
107049
Colombia
COL
true
2
1
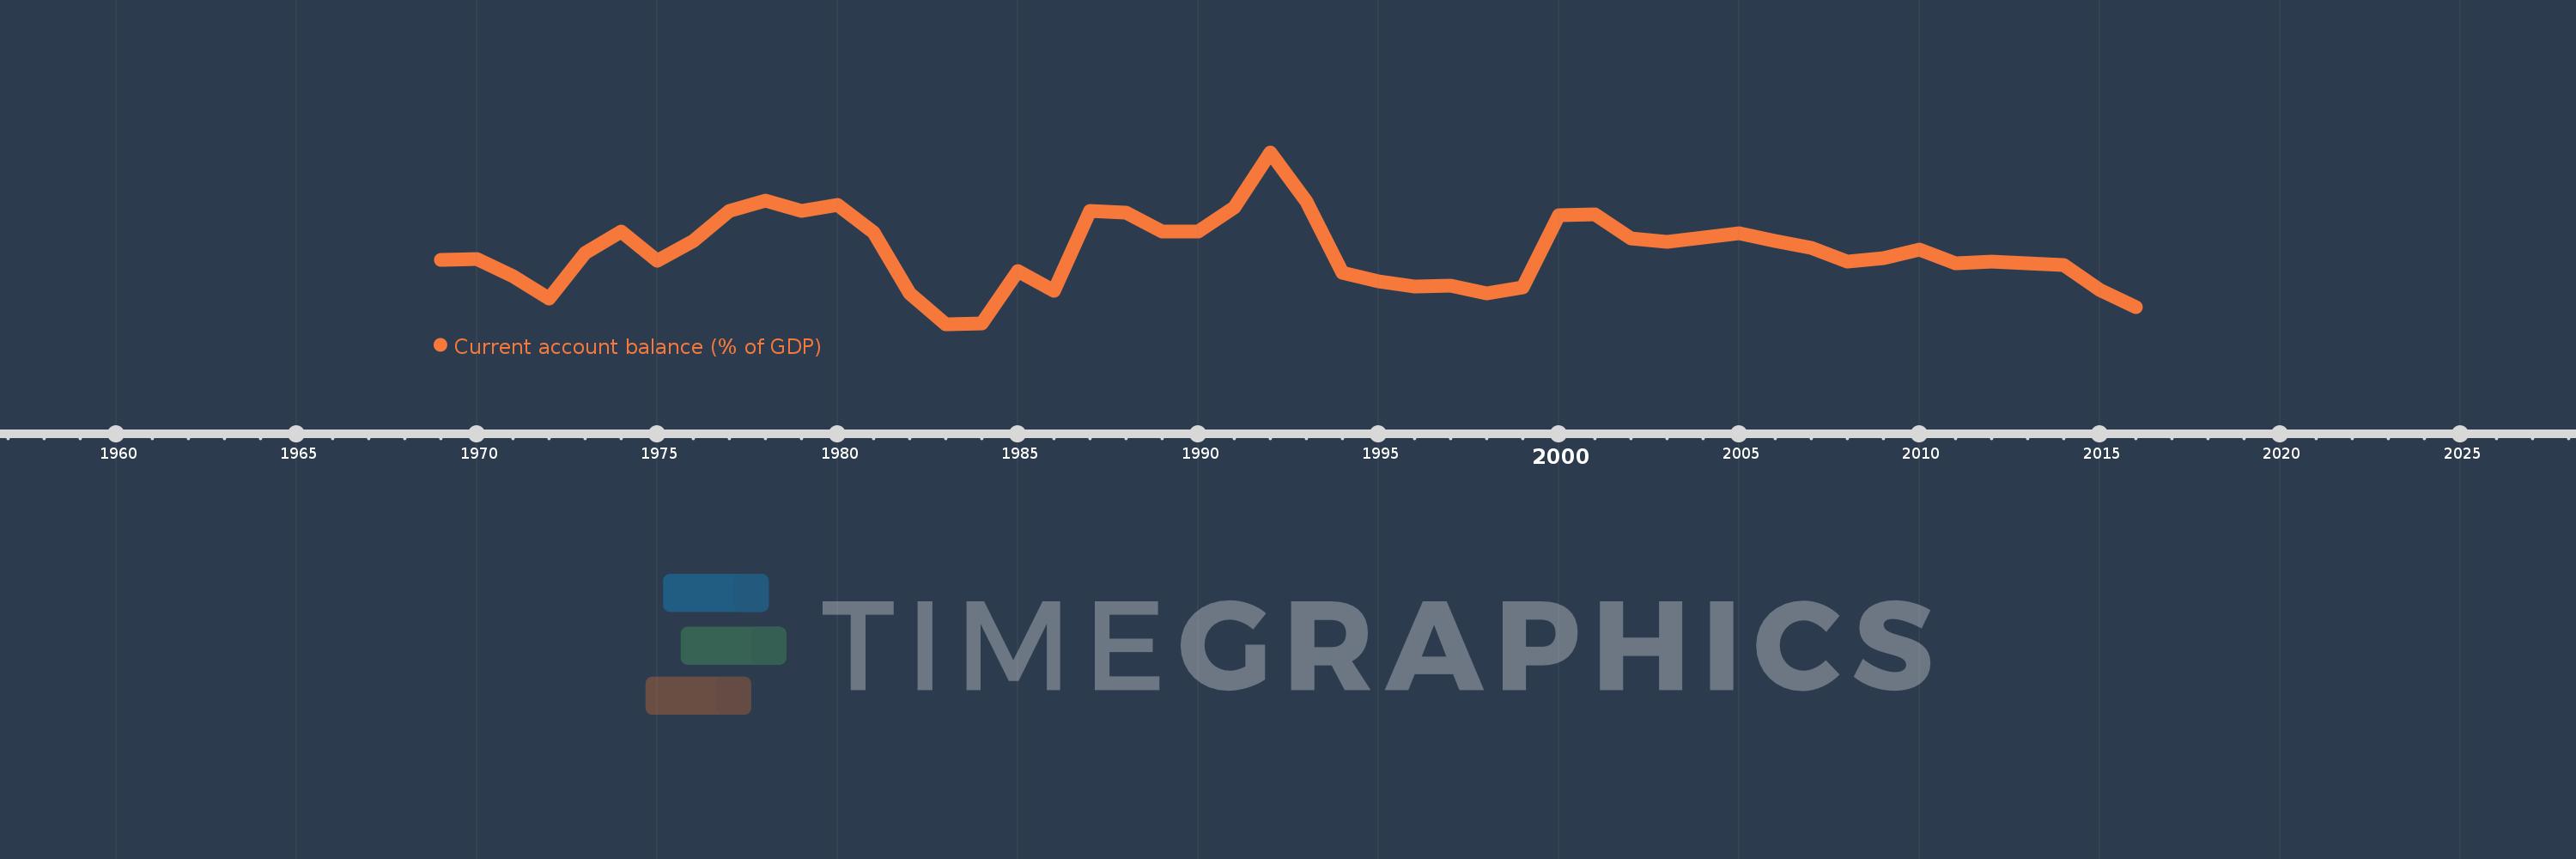
Current account balance (% of GDP)
2016,2015,2014,2013,2012,2011,2010,2009,2008,2007,2006,2005,2004,2003,2002,2001,2000,1999,1998,1997,1996,1995,1994,1993,1992,1991,1990,1989,1988,1987,1986,1985,1984,1983,1982,1981,1980,1979,1978,1977,1976,1975,1974,1973,1972,1971,1970,1969
This statistics in other country:
AfghanistanAlbaniaAlgeriaAngolaAntigua and BarbudaArgentinaArmeniaArubaAustraliaAustriaAzerbaijanBahamas, TheBahrainBangladeshBarbadosBelarusBelgiumBelizeBeninBermudaBhutanBoliviaBosnia and HerzegovinaBotswanaBrazilBrunei DarussalamBulgariaBurkina FasoBurundiCabo VerdeCambodiaCameroonCanadaCentral African RepublicChadChileChinaColombiaComorosCongo, Dem. Rep.Congo, Rep.Costa RicaCote d'IvoireCroatiaCyprusCzech RepublicDenmarkDjiboutiDominicaDominican RepublicEcuadorEgypt, Arab Rep.El SalvadorEquatorial GuineaEritreaEstoniaEthiopiaFaroe IslandsFijiFinlandFranceGabonGambia, TheGeorgiaGermanyGhanaGreeceGrenadaGuatemalaGuineaGuinea-BissauGuyanaHaitiHondurasHong Kong SAR, ChinaHungaryIcelandIndiaIndonesiaIran, Islamic Rep.IraqIrelandIsraelItalyJamaicaJapanJordanKazakhstanKenyaKiribatiKorea, Rep.KosovoKuwaitKyrgyz RepublicLao PDRLatviaLebanonLesothoLiberiaLibyaLithuaniaLuxembourgMacao SAR, ChinaMacedonia, FYRMadagascarMalawiMalaysiaMaldivesMaliMaltaMarshall IslandsMauritaniaMauritiusMexicoMicronesia, Fed. Sts.MoldovaMongoliaMontenegroMoroccoMozambiqueMyanmarNamibiaNepalNetherlandsNew ZealandNicaraguaNigerNigeriaNorwayOmanPakistanPalauPanamaPapua New GuineaParaguayPeruPhilippinesPolandPortugalQatarRomaniaRussian FederationRwandaSamoaSao Tome and PrincipeSaudi ArabiaSenegalSerbiaSeychellesSierra LeoneSingaporeSlovak RepublicSloveniaSolomon IslandsSouth AfricaSouth SudanSpainSri LankaSt. Kitts and NevisSt. LuciaSt. Vincent and the GrenadinesSudanSurinameSwazilandSwedenSwitzerlandSyrian Arab RepublicTajikistanTanzaniaThailandTimor-LesteTogoTongaTrinidad and TobagoTunisiaTurkeyTuvaluUgandaUkraineUnited KingdomUnited StatesUruguayVanuatuVenezuela, RBVietnamWest Bank and GazaYemen, Rep.ZambiaZimbabwe Timeline:
This timeline shows a graph from 1969 to 2016 of Colombia. No data until 1968. Number of actual observations by date: 48.
Source name:
World Development Indicators
Source organization:
International Monetary Fund, Balance of Payments Statistics Yearbook and data files, and World Bank and OECD GDP estimates.
Categories, topics:
Economy & Growth
Last updated:
apr 23, 2017
Indicators value changes by year
Minimum:
-7.837
jan 1, 1983
At the date of observation
Value
Absolute change
Change from previous value
jan 1, 1969
-2.771
-2.771
0.0%
jan 1, 1970
-2.732
+0.039
-1.41%
jan 1, 1971
-4.07
-1.338
48.99%
jan 1, 1972
-5.805
-1.735
42.62%
jan 1, 1973
-2.205
+3.6
-62.01%
jan 1, 1974
-0.531
+1.675
-75.94%
jan 1, 1975
-2.845
-2.314
436.09%
jan 1, 1976
-1.311
+1.534
-53.93%
jan 1, 1977
1.062
+2.372
-181.0%
jan 1, 1978
1.928
+0.867
81.63%
jan 1, 1979
1.11
-0.819
-42.45%
jan 1, 1980
1.568
+0.458
41.29%
jan 1, 1981
-0.616
-2.184
-139.31%
jan 1, 1982
-5.39
-4.774
774.6%
jan 1, 1983
-7.837
-2.447
45.4%
jan 1, 1984
-7.754
+0.083
-1.06%
jan 1, 1985
-3.662
+4.091
-52.77%
jan 1, 1986
-5.184
-1.522
41.55%
jan 1, 1987
1.096
+6.28
-121.14%
jan 1, 1988
0.924
-0.172
-15.72%
jan 1, 1989
-0.551
-1.475
-159.63%
jan 1, 1990
-0.508
+0.042
-7.72%
jan 1, 1991
1.346
+1.854
-364.74%
jan 1, 1992
5.696
+4.35
323.21%
jan 1, 1993
1.828
-3.868
-67.91%
jan 1, 1994
-3.768
-5.595
-306.13%
jan 1, 1995
-4.488
-0.721
19.13%
jan 1, 1996
-4.882
-0.393
8.77%
jan 1, 1997
-4.777
+0.105
-2.15%
jan 1, 1998
-5.391
-0.615
12.87%
jan 1, 1999
-4.934
+0.457
-8.48%
jan 1, 2000
0.779
+5.713
-115.78%
jan 1, 2001
0.833
+0.055
7.06%
jan 1, 2002
-1.057
-1.89
-226.78%
jan 1, 2003
-1.33
-0.273
25.86%
jan 1, 2004
-0.999
+0.331
-24.88%
jan 1, 2005
-0.668
+0.331
-33.14%
jan 1, 2006
-1.291
-0.623
93.31%
jan 1, 2007
-1.791
-0.499
38.67%
jan 1, 2008
-2.897
-1.106
61.79%
jan 1, 2009
-2.648
+0.249
-8.59%
jan 1, 2010
-1.988
+0.66
-24.92%
jan 1, 2011
-3.018
-1.03
51.81%
jan 1, 2012
-2.899
+0.12
-3.97%
jan 1, 2013
-3.034
-0.135
4.66%
jan 1, 2014
-3.189
-0.155
5.11%
jan 1, 2015
-5.142
-1.954
61.28%
jan 1, 2016
-6.484
-1.342
26.09%
Ranking of countries by current statistics by years


Comments: