29
/
en
AIzaSyAYiBZKx7MnpbEhh9jyipgxe19OcubqV5w
April 1, 2024
108389
Comoros
COM
true
2
1
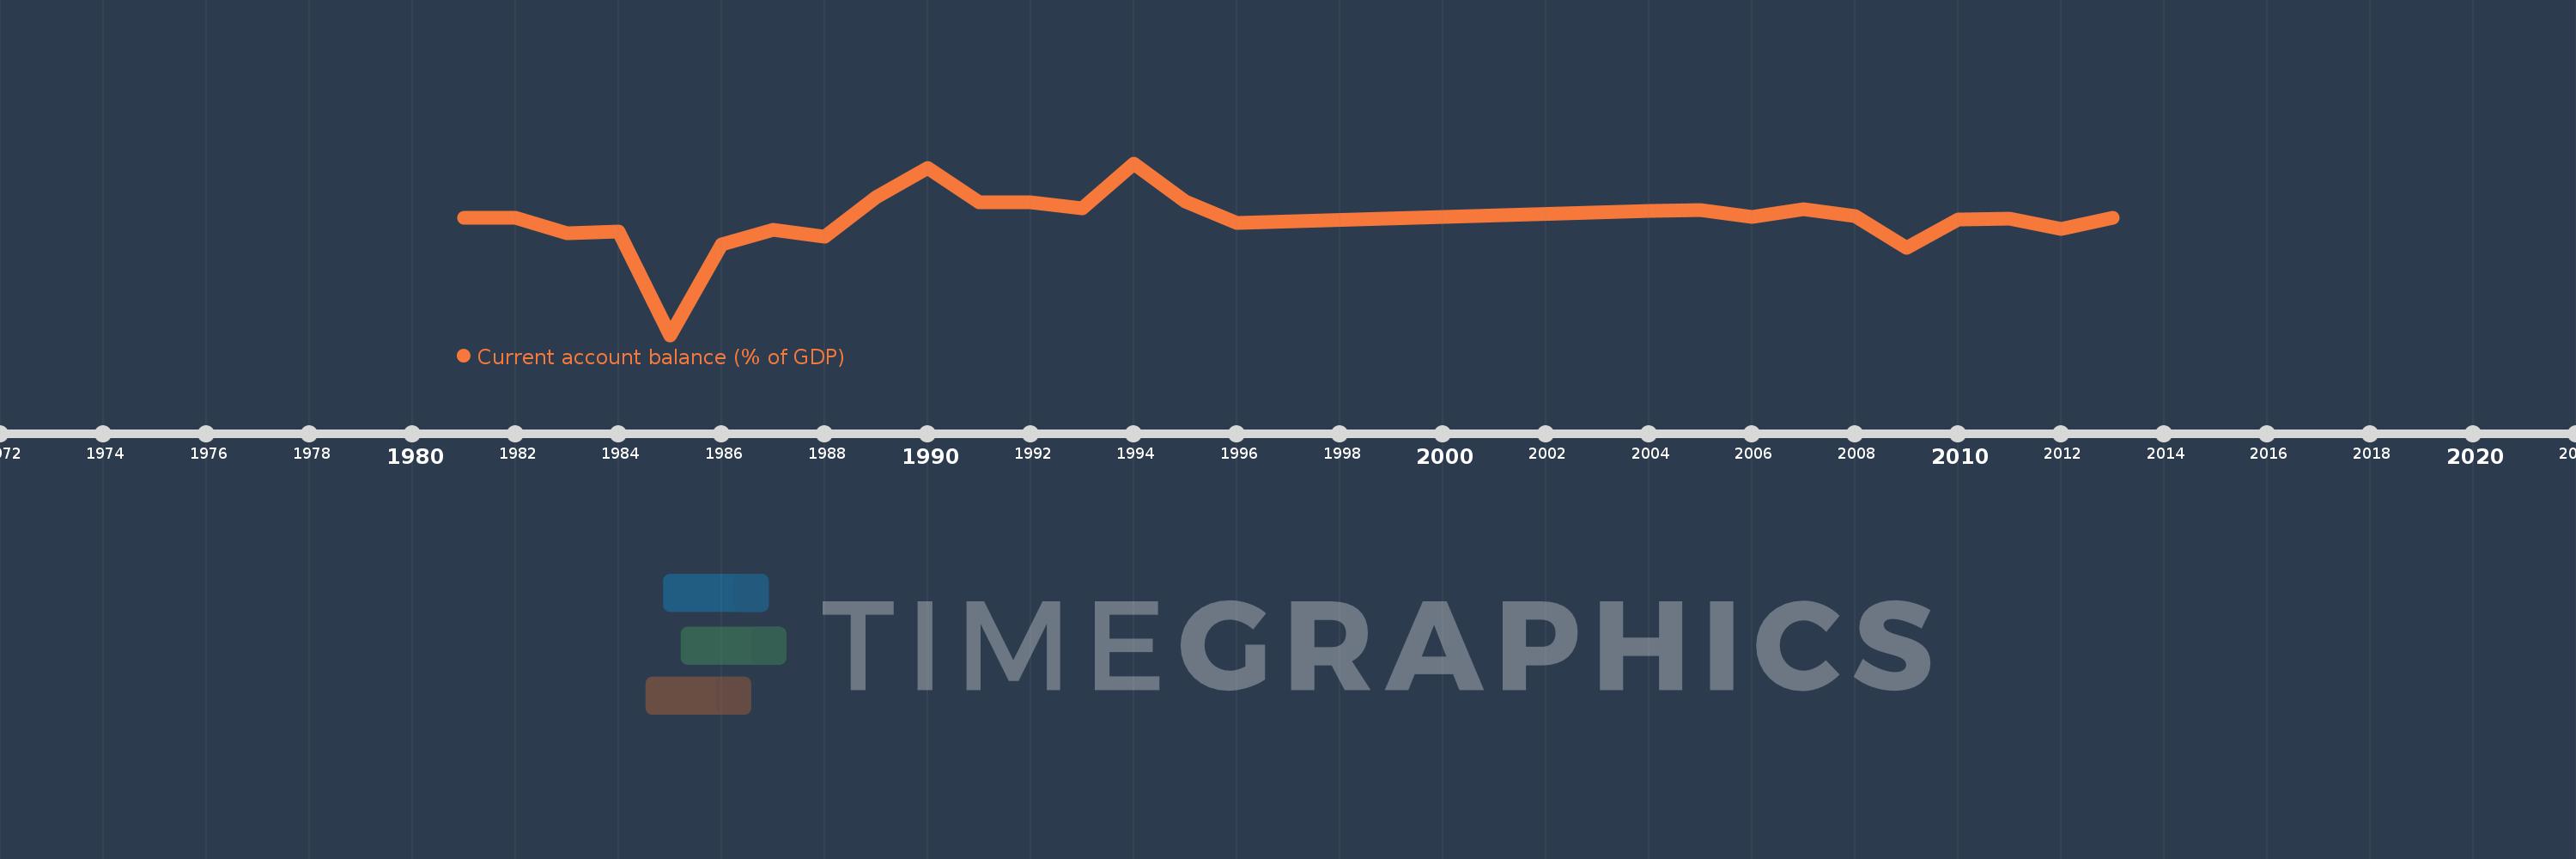
Current account balance (% of GDP)
2013,2012,2011,2010,2009,2008,2007,2006,2005,2004,1996,1995,1994,1993,1992,1991,1990,1989,1988,1987,1986,1985,1984,1983,1982,1981
This statistics in other country:
AfghanistanAlbaniaAlgeriaAngolaAntigua and BarbudaArgentinaArmeniaArubaAustraliaAustriaAzerbaijanBahamas, TheBahrainBangladeshBarbadosBelarusBelgiumBelizeBeninBermudaBhutanBoliviaBosnia and HerzegovinaBotswanaBrazilBrunei DarussalamBulgariaBurkina FasoBurundiCabo VerdeCambodiaCameroonCanadaCentral African RepublicChadChileChinaColombiaComorosCongo, Dem. Rep.Congo, Rep.Costa RicaCote d'IvoireCroatiaCyprusCzech RepublicDenmarkDjiboutiDominicaDominican RepublicEcuadorEgypt, Arab Rep.El SalvadorEquatorial GuineaEritreaEstoniaEthiopiaFaroe IslandsFijiFinlandFranceGabonGambia, TheGeorgiaGermanyGhanaGreeceGrenadaGuatemalaGuineaGuinea-BissauGuyanaHaitiHondurasHong Kong SAR, ChinaHungaryIcelandIndiaIndonesiaIran, Islamic Rep.IraqIrelandIsraelItalyJamaicaJapanJordanKazakhstanKenyaKiribatiKorea, Rep.KosovoKuwaitKyrgyz RepublicLao PDRLatviaLebanonLesothoLiberiaLibyaLithuaniaLuxembourgMacao SAR, ChinaMacedonia, FYRMadagascarMalawiMalaysiaMaldivesMaliMaltaMarshall IslandsMauritaniaMauritiusMexicoMicronesia, Fed. Sts.MoldovaMongoliaMontenegroMoroccoMozambiqueMyanmarNamibiaNepalNetherlandsNew ZealandNicaraguaNigerNigeriaNorwayOmanPakistanPalauPanamaPapua New GuineaParaguayPeruPhilippinesPolandPortugalQatarRomaniaRussian FederationRwandaSamoaSao Tome and PrincipeSaudi ArabiaSenegalSerbiaSeychellesSierra LeoneSingaporeSlovak RepublicSloveniaSolomon IslandsSouth AfricaSouth SudanSpainSri LankaSt. Kitts and NevisSt. LuciaSt. Vincent and the GrenadinesSudanSurinameSwazilandSwedenSwitzerlandSyrian Arab RepublicTajikistanTanzaniaThailandTimor-LesteTogoTongaTrinidad and TobagoTunisiaTurkeyTuvaluUgandaUkraineUnited KingdomUnited StatesUruguayVanuatuVenezuela, RBVietnamWest Bank and GazaYemen, Rep.ZambiaZimbabwe Timeline:
This timeline shows a graph from 1981 to 2013 of Comoros. No data until 1980. Number of actual observations by date: 26.
Source name:
World Development Indicators
Source organization:
International Monetary Fund, Balance of Payments Statistics Yearbook and data files, and World Bank and OECD GDP estimates.
Categories, topics:
Economy & Growth
Last updated:
apr 23, 2017
Indicators value changes by year
Minimum:
-30.44
jan 1, 1985
At the date of observation
Value
Absolute change
Change from previous value
jan 1, 1981
-7.212
-7.212
0.0%
jan 1, 1982
-7.137
+0.076
-1.05%
jan 1, 1983
-10.233
-3.096
43.39%
jan 1, 1984
-9.912
+0.322
-3.14%
jan 1, 1985
-30.44
-20.528
207.12%
jan 1, 1986
-12.452
+17.988
-59.09%
jan 1, 1987
-9.653
+2.799
-22.48%
jan 1, 1988
-10.877
-1.223
12.67%
jan 1, 1989
-3.141
+7.736
-71.12%
jan 1, 1990
2.721
+5.862
-186.63%
jan 1, 1991
-4.19
-6.911
-253.97%
jan 1, 1992
-4.153
+0.037
-0.88%
jan 1, 1993
-5.331
-1.178
28.38%
jan 1, 1994
3.632
+8.963
-168.14%
jan 1, 1995
-3.885
-7.517
-206.95%
jan 1, 1996
-8.177
-4.293
110.49%
jan 1, 2004
-5.794
+2.384
-29.15%
jan 1, 2005
-5.622
+0.171
-2.96%
jan 1, 2006
-7.056
-1.434
25.5%
jan 1, 2007
-5.545
+1.511
-21.42%
jan 1, 2008
-6.828
-1.283
23.14%
jan 1, 2009
-13.135
-6.307
92.37%
jan 1, 2010
-7.484
+5.651
-43.02%
jan 1, 2011
-7.408
+0.076
-1.02%
jan 1, 2012
-9.454
-2.046
27.62%
jan 1, 2013
-7.207
+2.247
-23.77%
Ranking of countries by current statistics by years


Comments: