29
/
en
AIzaSyAYiBZKx7MnpbEhh9jyipgxe19OcubqV5w
April 1, 2024
119752
Djibouti
DJI
true
2
1
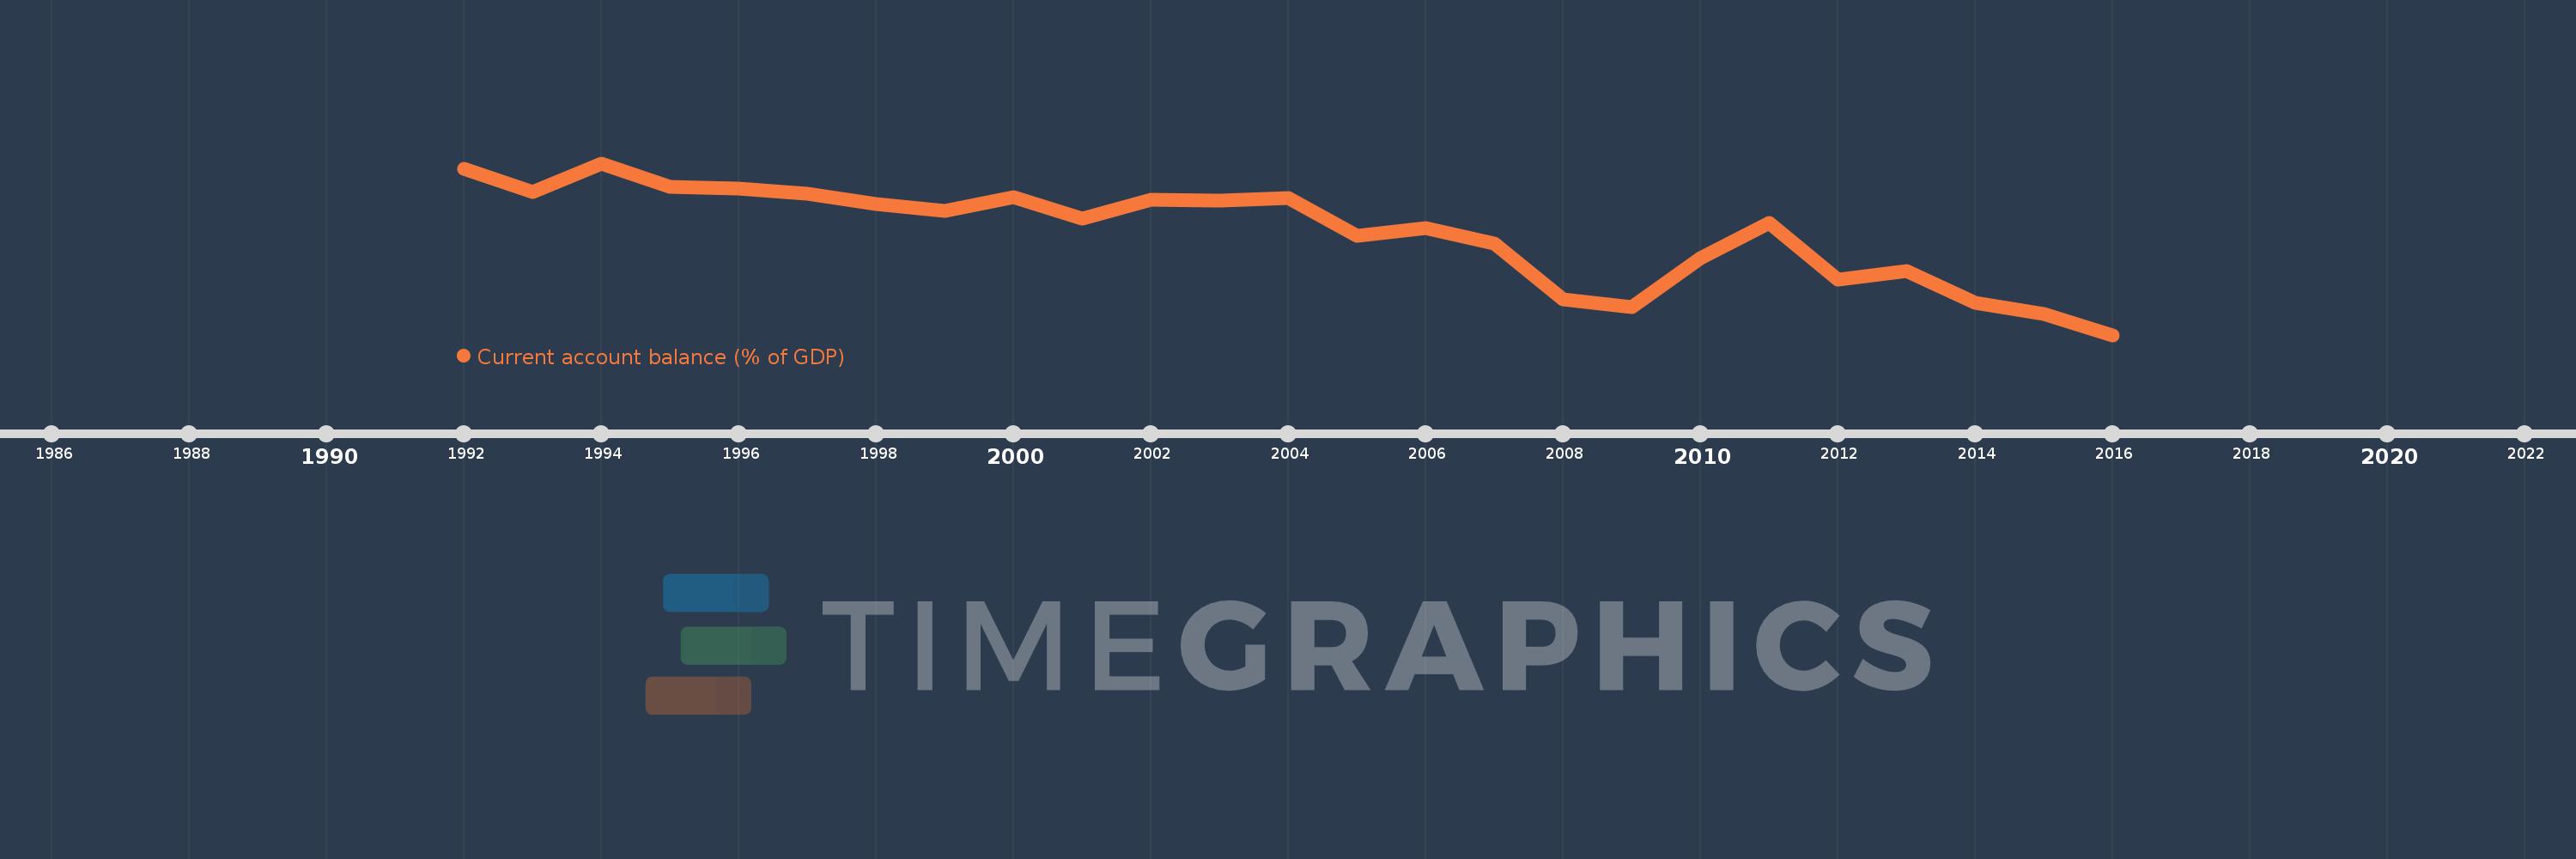
Current account balance (% of GDP)
2016,2015,2014,2013,2012,2011,2010,2009,2008,2007,2006,2005,2004,2003,2002,2001,2000,1999,1998,1997,1996,1995,1994,1993,1992
This statistics in other country:
AfghanistanAlbaniaAlgeriaAngolaAntigua and BarbudaArgentinaArmeniaArubaAustraliaAustriaAzerbaijanBahamas, TheBahrainBangladeshBarbadosBelarusBelgiumBelizeBeninBermudaBhutanBoliviaBosnia and HerzegovinaBotswanaBrazilBrunei DarussalamBulgariaBurkina FasoBurundiCabo VerdeCambodiaCameroonCanadaCentral African RepublicChadChileChinaColombiaComorosCongo, Dem. Rep.Congo, Rep.Costa RicaCote d'IvoireCroatiaCyprusCzech RepublicDenmarkDjiboutiDominicaDominican RepublicEcuadorEgypt, Arab Rep.El SalvadorEquatorial GuineaEritreaEstoniaEthiopiaFaroe IslandsFijiFinlandFranceGabonGambia, TheGeorgiaGermanyGhanaGreeceGrenadaGuatemalaGuineaGuinea-BissauGuyanaHaitiHondurasHong Kong SAR, ChinaHungaryIcelandIndiaIndonesiaIran, Islamic Rep.IraqIrelandIsraelItalyJamaicaJapanJordanKazakhstanKenyaKiribatiKorea, Rep.KosovoKuwaitKyrgyz RepublicLao PDRLatviaLebanonLesothoLiberiaLibyaLithuaniaLuxembourgMacao SAR, ChinaMacedonia, FYRMadagascarMalawiMalaysiaMaldivesMaliMaltaMarshall IslandsMauritaniaMauritiusMexicoMicronesia, Fed. Sts.MoldovaMongoliaMontenegroMoroccoMozambiqueMyanmarNamibiaNepalNetherlandsNew ZealandNicaraguaNigerNigeriaNorwayOmanPakistanPalauPanamaPapua New GuineaParaguayPeruPhilippinesPolandPortugalQatarRomaniaRussian FederationRwandaSamoaSao Tome and PrincipeSaudi ArabiaSenegalSerbiaSeychellesSierra LeoneSingaporeSlovak RepublicSloveniaSolomon IslandsSouth AfricaSouth SudanSpainSri LankaSt. Kitts and NevisSt. LuciaSt. Vincent and the GrenadinesSudanSurinameSwazilandSwedenSwitzerlandSyrian Arab RepublicTajikistanTanzaniaThailandTimor-LesteTogoTongaTrinidad and TobagoTunisiaTurkeyTuvaluUgandaUkraineUnited KingdomUnited StatesUruguayVanuatuVenezuela, RBVietnamWest Bank and GazaYemen, Rep.ZambiaZimbabwe Timeline:
This timeline shows a graph from 1992 to 2016 of Djibouti. No data until 1991. Number of actual observations by date: 25.
Source name:
World Development Indicators
Source organization:
International Monetary Fund, Balance of Payments Statistics Yearbook and data files, and World Bank and OECD GDP estimates.
Categories, topics:
Economy & Growth
Last updated:
apr 23, 2017
Indicators value changes by year
Minimum:
-31.718
jan 1, 2016
Maximum:
23.826
jan 1, 1994
At the date of observation
Value
Absolute change
Change from previous value
jan 1, 1992
22.073
+22.073
0.0%
jan 1, 1993
14.651
-7.422
-33.62%
jan 1, 1994
23.826
+9.174
62.62%
jan 1, 1995
16.315
-7.51
-31.52%
jan 1, 1996
15.599
-0.717
-4.39%
jan 1, 1997
13.862
-1.737
-11.13%
jan 1, 1998
10.603
-3.259
-23.51%
jan 1, 1999
8.532
-2.071
-19.53%
jan 1, 2000
12.965
+4.433
51.95%
jan 1, 2001
6.042
-6.923
-53.4%
jan 1, 2002
12.028
+5.986
99.07%
jan 1, 2003
11.825
-0.203
-1.68%
jan 1, 2004
12.706
+0.88
7.44%
jan 1, 2005
0.473
-12.232
-96.28%
jan 1, 2006
2.841
+2.368
500.55%
jan 1, 2007
-2.154
-4.996
-175.83%
jan 1, 2008
-20.209
-18.054
837.98%
jan 1, 2009
-22.559
-2.35
11.63%
jan 1, 2010
-6.777
+15.782
-69.96%
jan 1, 2011
4.474
+11.251
-166.01%
jan 1, 2012
-13.868
-18.341
-409.99%
jan 1, 2013
-10.931
+2.937
-21.18%
jan 1, 2014
-21.205
-10.274
93.98%
jan 1, 2015
-24.845
-3.64
17.17%
jan 1, 2016
-31.718
-6.873
27.66%
Ranking of countries by current statistics by years


Comments: