29
/
en
AIzaSyAYiBZKx7MnpbEhh9jyipgxe19OcubqV5w
April 1, 2024
157104
Iran, Islamic Rep.
IRN
true
2
1
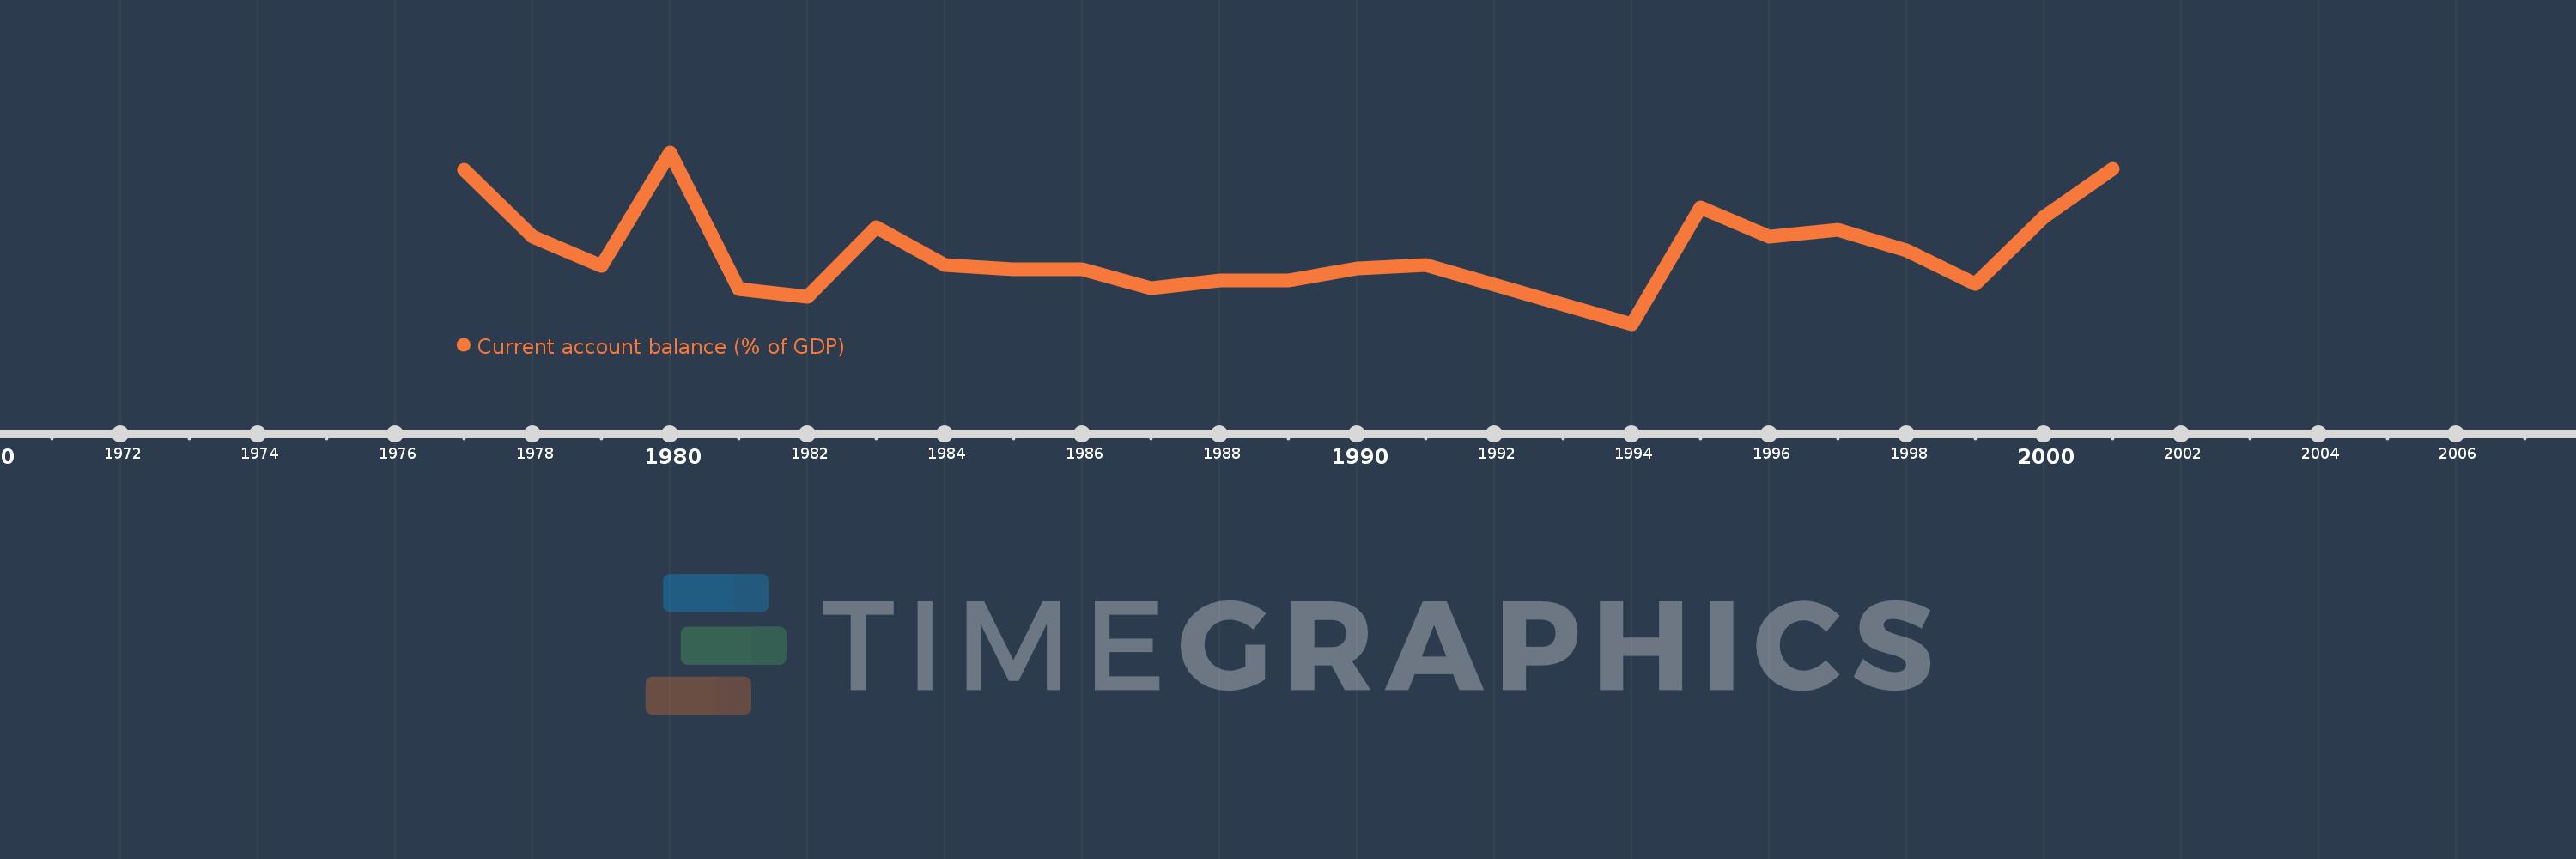
Current account balance (% of GDP)
2001,2000,1999,1998,1997,1996,1995,1994,1991,1990,1989,1988,1987,1986,1985,1984,1983,1982,1981,1980,1979,1978,1977
This statistics in other country:
AfghanistanAlbaniaAlgeriaAngolaAntigua and BarbudaArgentinaArmeniaArubaAustraliaAustriaAzerbaijanBahamas, TheBahrainBangladeshBarbadosBelarusBelgiumBelizeBeninBermudaBhutanBoliviaBosnia and HerzegovinaBotswanaBrazilBrunei DarussalamBulgariaBurkina FasoBurundiCabo VerdeCambodiaCameroonCanadaCentral African RepublicChadChileChinaColombiaComorosCongo, Dem. Rep.Congo, Rep.Costa RicaCote d'IvoireCroatiaCyprusCzech RepublicDenmarkDjiboutiDominicaDominican RepublicEcuadorEgypt, Arab Rep.El SalvadorEquatorial GuineaEritreaEstoniaEthiopiaFaroe IslandsFijiFinlandFranceGabonGambia, TheGeorgiaGermanyGhanaGreeceGrenadaGuatemalaGuineaGuinea-BissauGuyanaHaitiHondurasHong Kong SAR, ChinaHungaryIcelandIndiaIndonesiaIran, Islamic Rep.IraqIrelandIsraelItalyJamaicaJapanJordanKazakhstanKenyaKiribatiKorea, Rep.KosovoKuwaitKyrgyz RepublicLao PDRLatviaLebanonLesothoLiberiaLibyaLithuaniaLuxembourgMacao SAR, ChinaMacedonia, FYRMadagascarMalawiMalaysiaMaldivesMaliMaltaMarshall IslandsMauritaniaMauritiusMexicoMicronesia, Fed. Sts.MoldovaMongoliaMontenegroMoroccoMozambiqueMyanmarNamibiaNepalNetherlandsNew ZealandNicaraguaNigerNigeriaNorwayOmanPakistanPalauPanamaPapua New GuineaParaguayPeruPhilippinesPolandPortugalQatarRomaniaRussian FederationRwandaSamoaSao Tome and PrincipeSaudi ArabiaSenegalSerbiaSeychellesSierra LeoneSingaporeSlovak RepublicSloveniaSolomon IslandsSouth AfricaSouth SudanSpainSri LankaSt. Kitts and NevisSt. LuciaSt. Vincent and the GrenadinesSudanSurinameSwazilandSwedenSwitzerlandSyrian Arab RepublicTajikistanTanzaniaThailandTimor-LesteTogoTongaTrinidad and TobagoTunisiaTurkeyTuvaluUgandaUkraineUnited KingdomUnited StatesUruguayVanuatuVenezuela, RBVietnamWest Bank and GazaYemen, Rep.ZambiaZimbabwe Timeline:
This timeline shows a graph from 1977 to 2001 of Iran, Islamic Rep.. No data until 1976. Number of actual observations by date: 23.
Source name:
World Development Indicators
Source organization:
International Monetary Fund, Balance of Payments Statistics Yearbook and data files, and World Bank and OECD GDP estimates.
Categories, topics:
Economy & Growth
Last updated:
apr 23, 2017
Indicators value changes by year
Minimum:
-6.612
jan 1, 1994
At the date of observation
Value
Absolute change
Change from previous value
jan 1, 1977
11.256
+11.256
0.0%
jan 1, 1978
3.494
-7.762
-68.96%
jan 1, 1979
0.133
-3.36
-96.18%
jan 1, 1980
13.24
+13.107
9.83K%
jan 1, 1981
-2.584
-15.824
-119.51%
jan 1, 1982
-3.429
-0.845
32.71%
jan 1, 1983
4.552
+7.981
-232.75%
jan 1, 1984
0.229
-4.323
-94.97%
jan 1, 1985
-0.255
-0.484
-211.43%
jan 1, 1986
-0.264
-0.009
3.55%
jan 1, 1987
-2.465
-2.201
833.24%
jan 1, 1988
-1.56
+0.906
-36.74%
jan 1, 1989
-1.519
+0.041
-2.62%
jan 1, 1990
-0.159
+1.36
-89.56%
jan 1, 1991
0.262
+0.421
-265.28%
jan 1, 1994
-6.612
-6.874
-2.62K%
jan 1, 1995
6.899
+13.511
-204.33%
jan 1, 1996
3.483
-3.416
-49.52%
jan 1, 1997
4.345
+0.863
24.77%
jan 1, 1998
1.943
-2.403
-55.29%
jan 1, 1999
-1.94
-3.882
-199.85%
jan 1, 2000
5.758
+7.697
-396.84%
jan 1, 2001
11.389
+5.631
97.8%
Ranking of countries by current statistics by years


Comments: