29
/
en
AIzaSyAYiBZKx7MnpbEhh9jyipgxe19OcubqV5w
April 1, 2024
106425
China
CHN
true
2
1
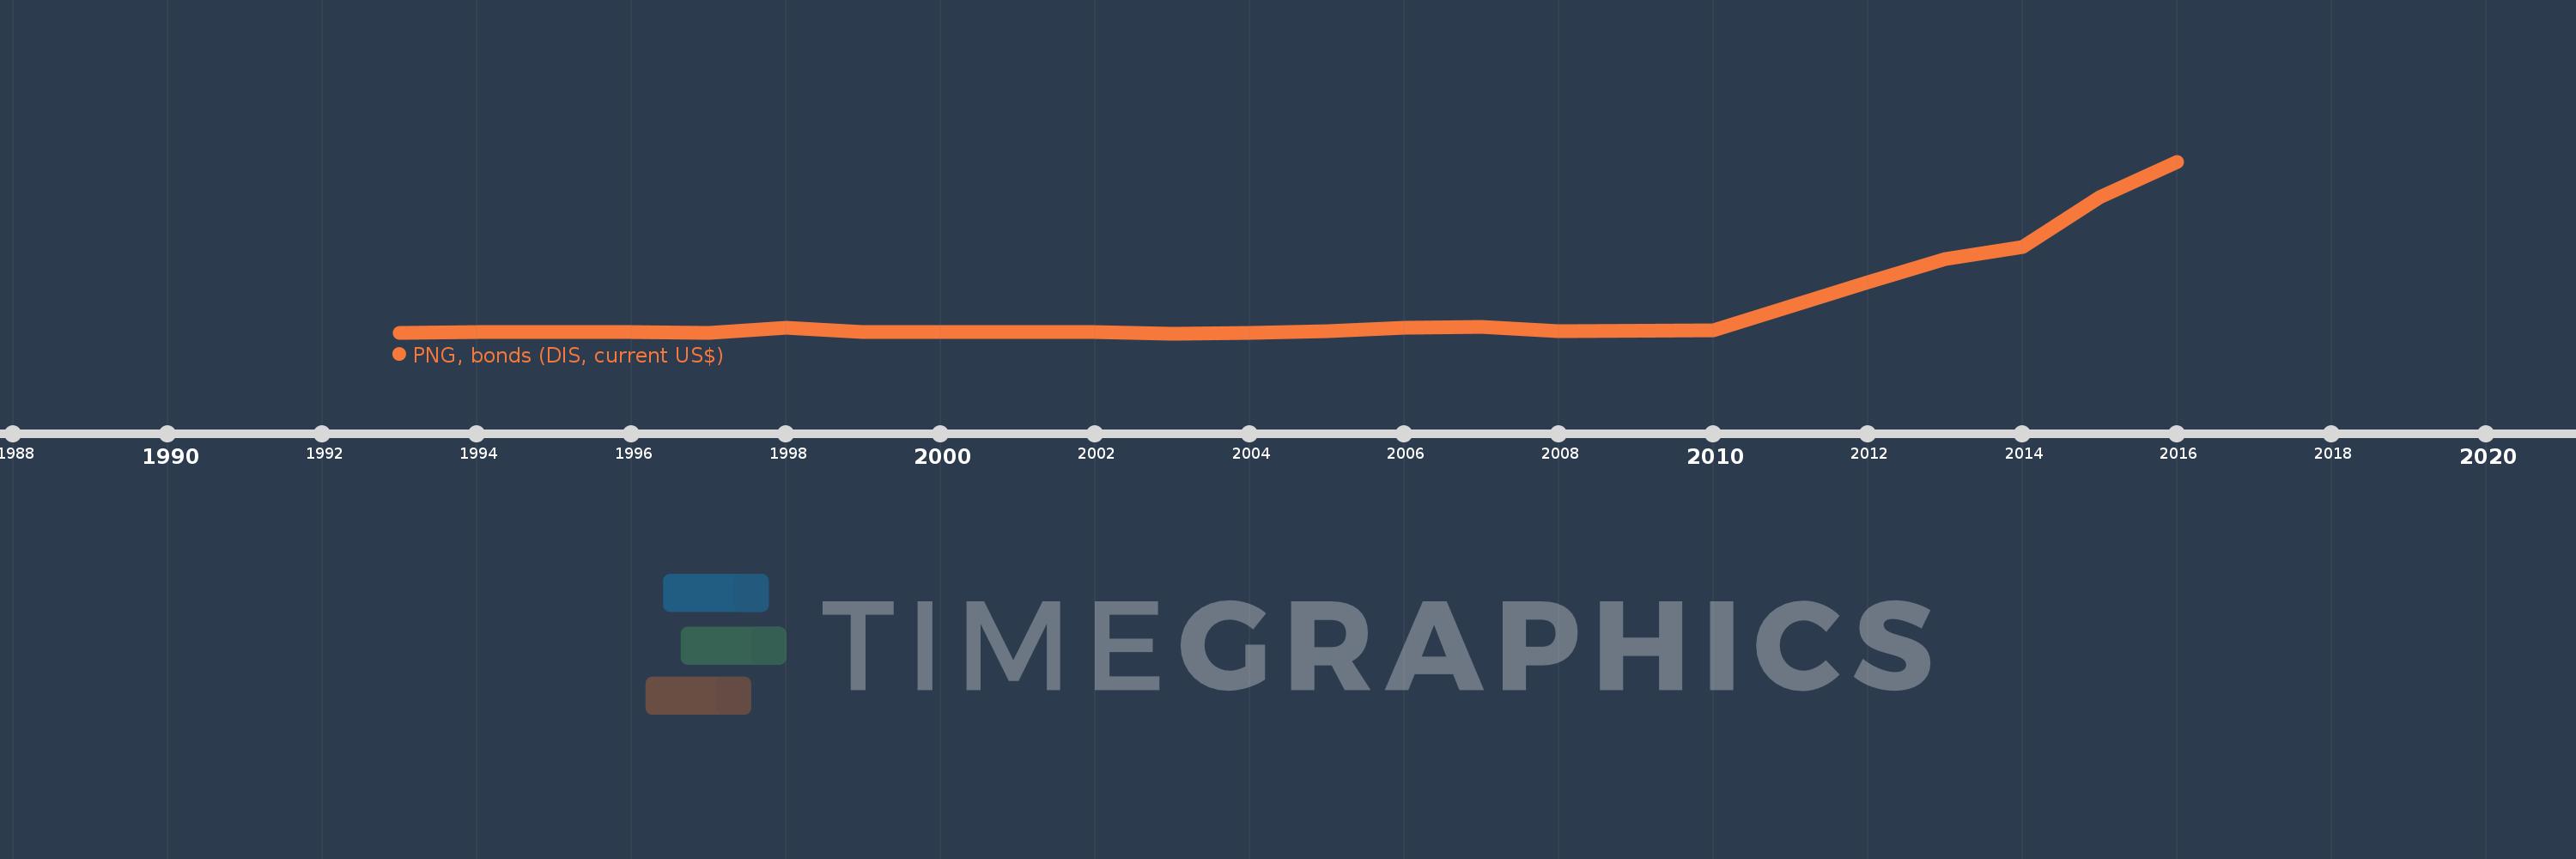
PNG, bonds (DIS, current US$)
2016,2015,2014,2013,2012,2010,2008,2007,2006,2005,2004,2003,2002,2001,1999,1998,1997,1996,1994,1993
This statistics in other country:
Timeline:
This timeline shows a graph from 1993 to 2016 of China. No data until 1992. Number of actual observations by date: 20.
Source name:
World Development Indicators
Source organization:
World Bank, International Debt Statistics.
Categories, topics:
External Debt
Last updated:
apr 23, 2017
Indicators value changes by year
Minimum:
90.0 mln
jan 1, 2003
Maximum:
47.61 bln
jan 1, 2016
At the date of observation
Value
Absolute change
Change from previous value
jan 1, 1993
197.575 mln
+197.575 mln
0.0%
jan 1, 1994
332.0 mln
+134.425 mln
68.04%
jan 1, 1996
543.889 mln
+211.889 mln
63.82%
jan 1, 1997
128.786 mln
-415.103 mln
-76.32%
jan 1, 1998
1.518 bln
+1.389 bln
1.08K%
jan 1, 1999
469.0 mln
-1.049 bln
-69.1%
jan 1, 2001
390.0 mln
-79.0 mln
-16.84%
jan 1, 2002
475.647 mln
+85.647 mln
21.96%
jan 1, 2003
90.0 mln
-385.647 mln
-81.08%
jan 1, 2004
175.0 mln
+85.0 mln
94.44%
jan 1, 2005
736.915 mln
+561.915 mln
321.09%
jan 1, 2006
1.622 bln
+885.23 mln
120.13%
jan 1, 2007
1.945 bln
+322.855 mln
19.9%
jan 1, 2008
740.0 mln
-1.205 bln
-61.95%
jan 1, 2010
925.0 mln
+185.0 mln
25.0%
jan 1, 2012
14.189 bln
+13.264 bln
1.43K%
jan 1, 2013
20.703 bln
+6.515 bln
45.91%
jan 1, 2014
23.897 bln
+3.193 bln
15.42%
jan 1, 2015
37.74 bln
+13.843 bln
57.93%
jan 1, 2016
47.61 bln
+9.87 bln
26.15%
Ranking of countries by current statistics by years


Comments: