29
/
en
AIzaSyAYiBZKx7MnpbEhh9jyipgxe19OcubqV5w
April 1, 2024
122632
Dominican Republic
DOM
true
2
1
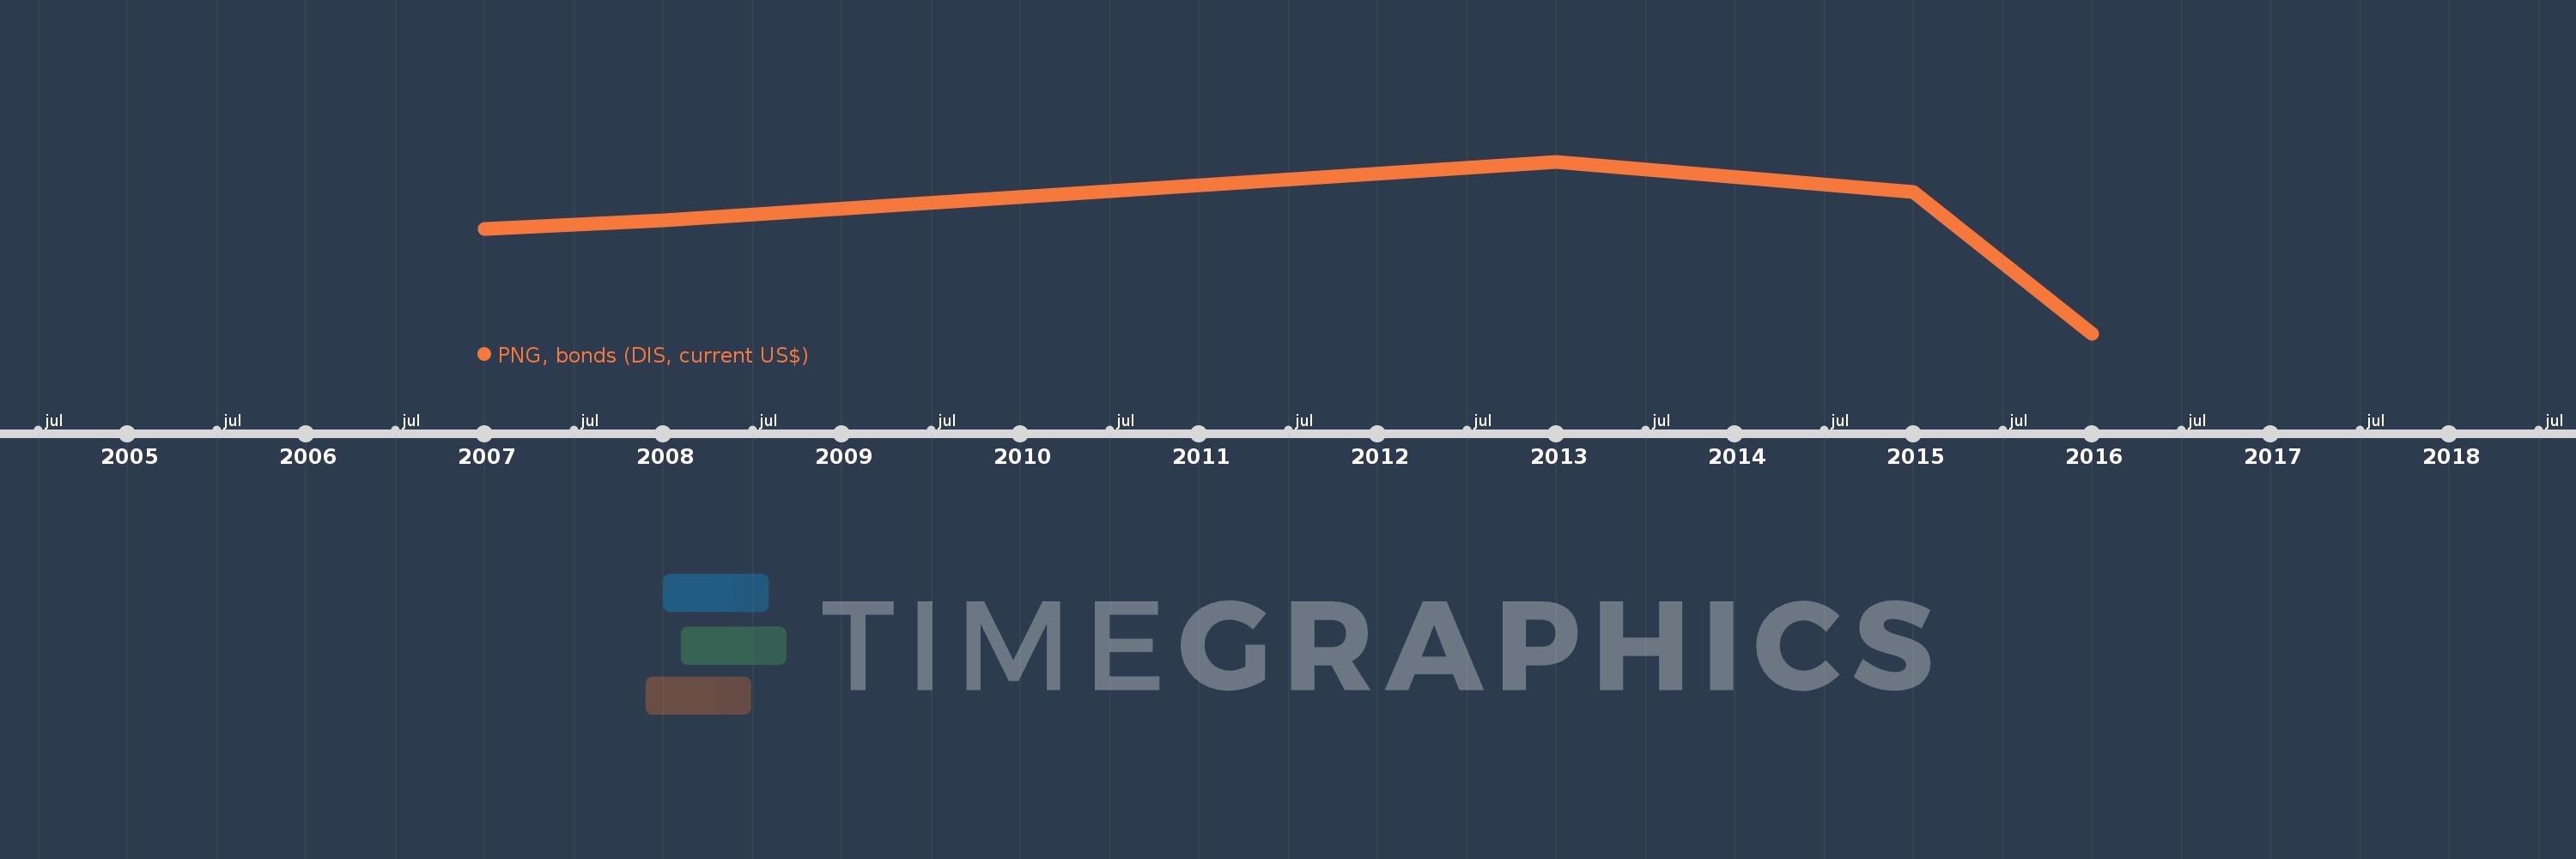
PNG, bonds (DIS, current US$)
2016,2015,2013,2008,2007
This statistics in other country:
Timeline:
This timeline shows a graph from 2007 to 2016 of Dominican Republic. No data until 2006. Number of actual observations by date: 5.
Source name:
World Development Indicators
Source organization:
World Bank, International Debt Statistics.
Categories, topics:
External Debt
Last updated:
apr 23, 2017
Indicators value changes by year
Minimum:
200.0 mln
jan 1, 2016
Maximum:
550.0 mln
jan 1, 2013
At the date of observation
Value
Absolute change
Change from previous value
jan 1, 2007
412.0 mln
+412.0 mln
0.0%
jan 1, 2008
430.623 mln
+18.623 mln
4.52%
jan 1, 2013
550.0 mln
+119.377 mln
27.72%
jan 1, 2015
488.35 mln
-61.65 mln
-11.21%
jan 1, 2016
200.0 mln
-288.35 mln
-59.05%
Ranking of countries by current statistics by years


Comments: