29
/
en
AIzaSyAYiBZKx7MnpbEhh9jyipgxe19OcubqV5w
April 1, 2024
246092
South Africa
ZAF
true
2
1
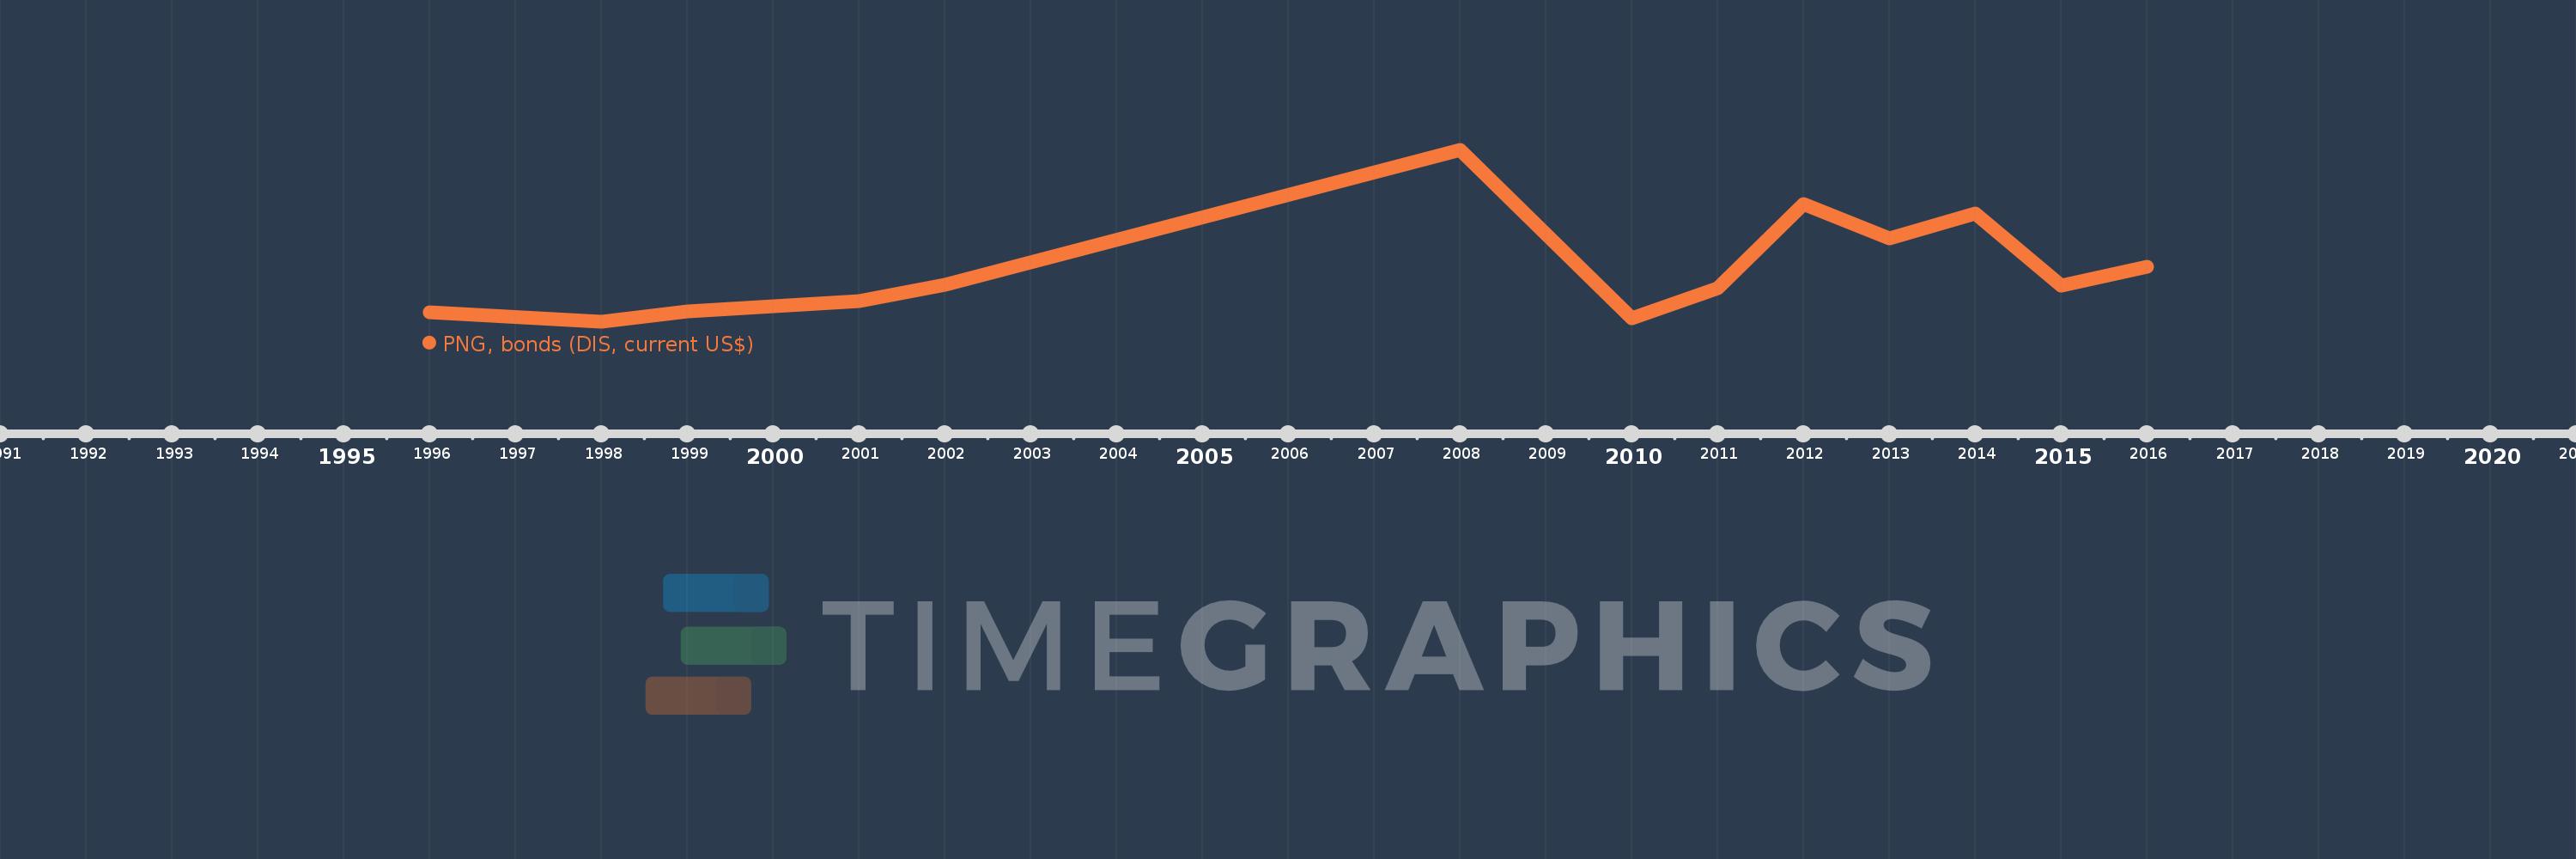
PNG, bonds (DIS, current US$)
2016,2015,2014,2013,2012,2011,2010,2008,2002,2001,1999,1998,1996
This statistics in other country:
Timeline:
This timeline shows a graph from 1996 to 2016 of South Africa. No data until 1995. Number of actual observations by date: 13.
Source name:
World Development Indicators
Source organization:
World Bank, International Debt Statistics.
Categories, topics:
External Debt
Last updated:
apr 23, 2017
Indicators value changes by year
Minimum:
45.0 mln
jan 1, 1998
Maximum:
5.587 bln
jan 1, 2008
At the date of observation
Value
Absolute change
Change from previous value
jan 1, 1996
350.0 mln
+350.0 mln
0.0%
jan 1, 1998
45.0 mln
-305.0 mln
-87.14%
jan 1, 1999
373.047 mln
+328.047 mln
728.99%
jan 1, 2001
712.011 mln
+338.964 mln
90.86%
jan 1, 2002
1.25 bln
+537.989 mln
75.56%
jan 1, 2008
5.587 bln
+4.337 bln
346.97%
jan 1, 2010
163.0 mln
-5.424 bln
-97.08%
jan 1, 2011
1.135 bln
+971.676 mln
596.12%
jan 1, 2012
3.852 bln
+2.717 bln
239.48%
jan 1, 2013
2.738 bln
-1.114 bln
-28.93%
jan 1, 2014
3.543 bln
+804.955 mln
29.4%
jan 1, 2015
1.209 bln
-2.333 bln
-65.86%
jan 1, 2016
1.823 bln
+613.938 mln
50.77%
Ranking of countries by current statistics by years


Comments: