29
/
en
AIzaSyAYiBZKx7MnpbEhh9jyipgxe19OcubqV5w
April 1, 2024
230224
Russian Federation
RUS
true
2
1
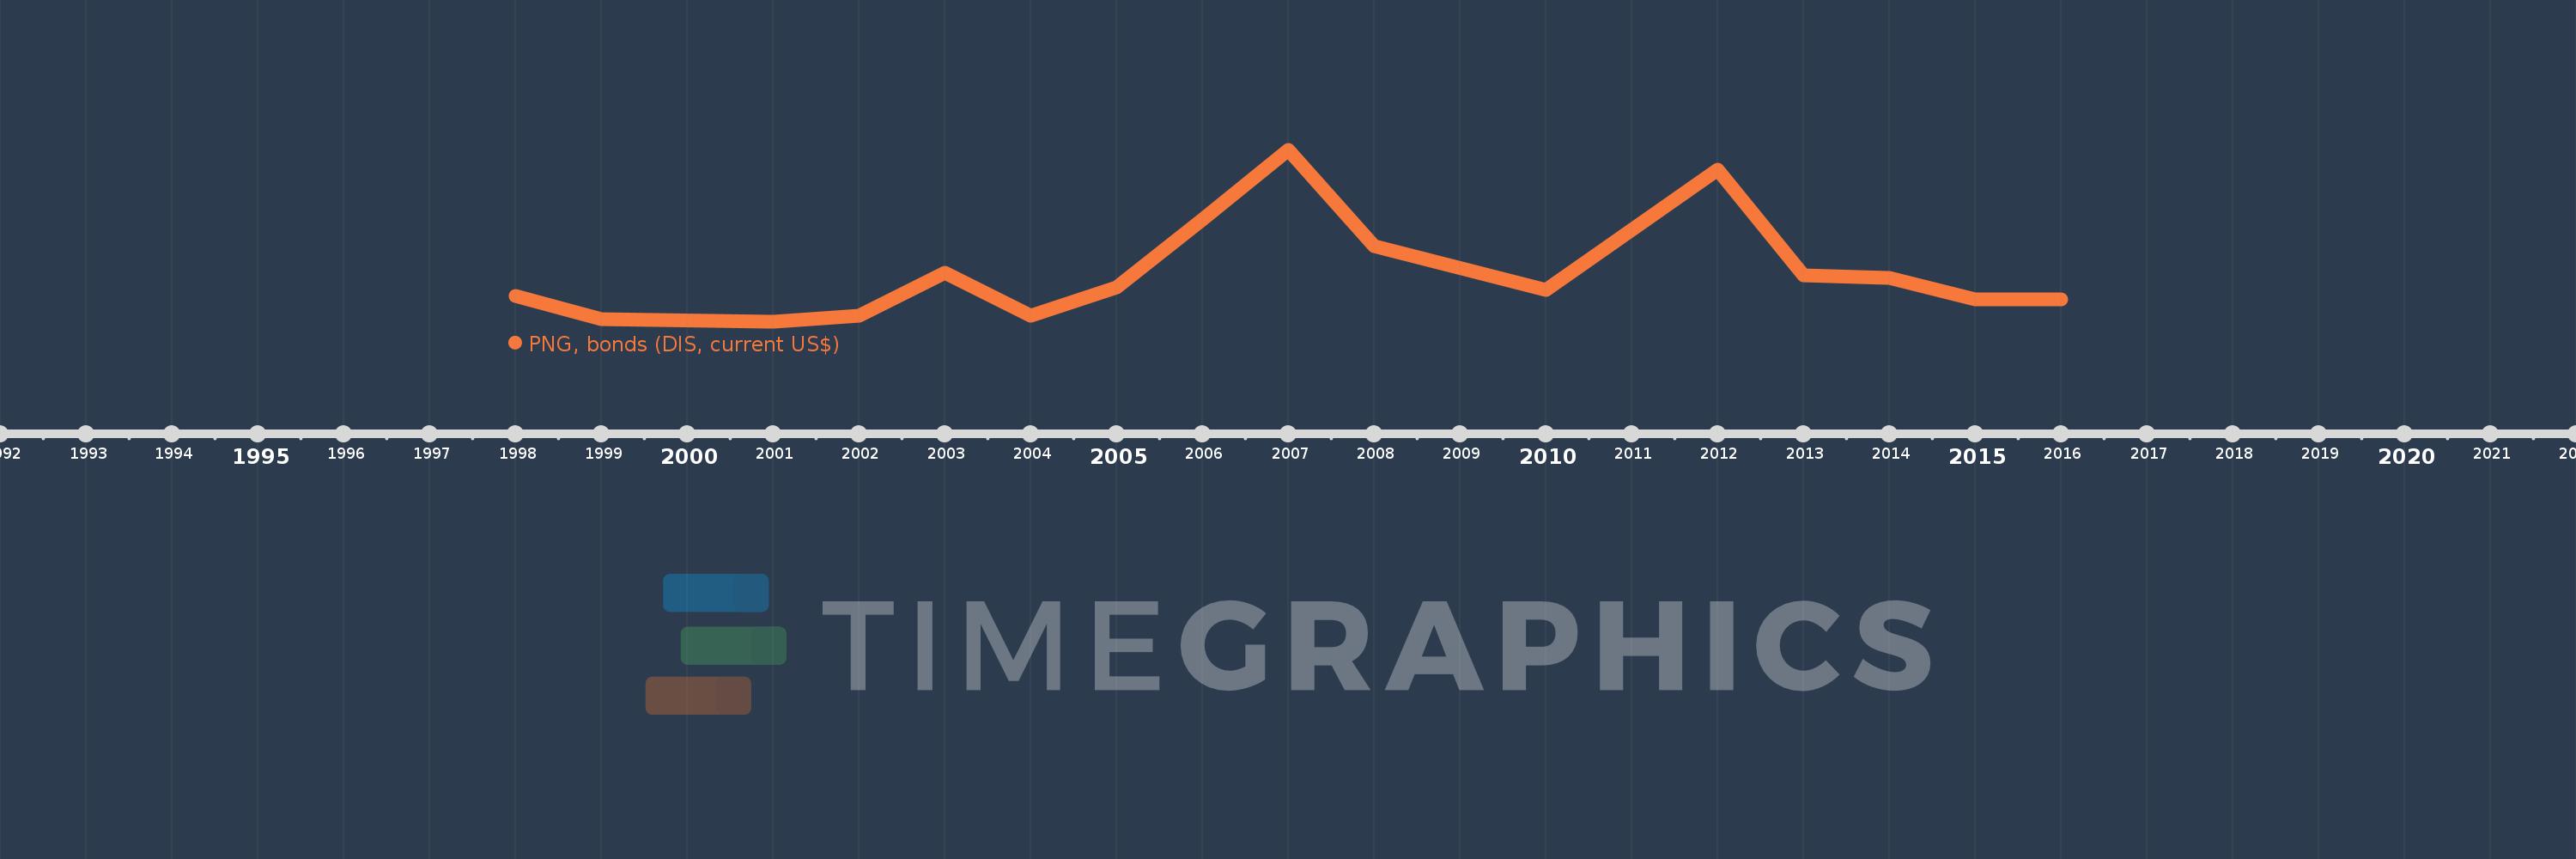
PNG, bonds (DIS, current US$)
2016,2015,2014,2013,2012,2010,2008,2007,2006,2005,2004,2003,2002,2001,1999,1998
This statistics in other country:
Timeline:
This timeline shows a graph from 1998 to 2016 of Russian Federation. No data until 1997. Number of actual observations by date: 16.
Source name:
World Development Indicators
Source organization:
World Bank, International Debt Statistics.
Categories, topics:
External Debt
Last updated:
apr 23, 2017
Indicators value changes by year
Minimum:
75.0 mln
jan 1, 2001
Maximum:
12.04 bln
jan 1, 2007
At the date of observation
Value
Absolute change
Change from previous value
jan 1, 1998
1.905 bln
+1.905 bln
0.0%
jan 1, 1999
278.049 mln
-1.627 bln
-85.4%
jan 1, 2001
75.0 mln
-203.049 mln
-73.03%
jan 1, 2002
527.83 mln
+452.83 mln
603.77%
jan 1, 2003
3.493 bln
+2.965 bln
561.74%
jan 1, 2004
517.953 mln
-2.975 bln
-85.17%
jan 1, 2005
2.515 bln
+1.997 bln
385.55%
jan 1, 2006
7.226 bln
+4.711 bln
187.33%
jan 1, 2007
12.04 bln
+4.814 bln
66.62%
jan 1, 2008
5.329 bln
-6.711 bln
-55.74%
jan 1, 2010
2.286 bln
-3.043 bln
-57.11%
jan 1, 2012
10.692 bln
+8.406 bln
367.75%
jan 1, 2013
3.299 bln
-7.393 bln
-69.14%
jan 1, 2014
3.12 bln
-179.636 mln
-5.44%
jan 1, 2015
1.64 bln
-1.479 bln
-47.43%
jan 1, 2016
1.62 bln
-20.077 mln
-1.22%
Ranking of countries by current statistics by years


Comments: