29
/pt/
pt
AIzaSyAYiBZKx7MnpbEhh9jyipgxe19OcubqV5w
April 1, 2024
99829
Cameroon
CMR
true
2
1
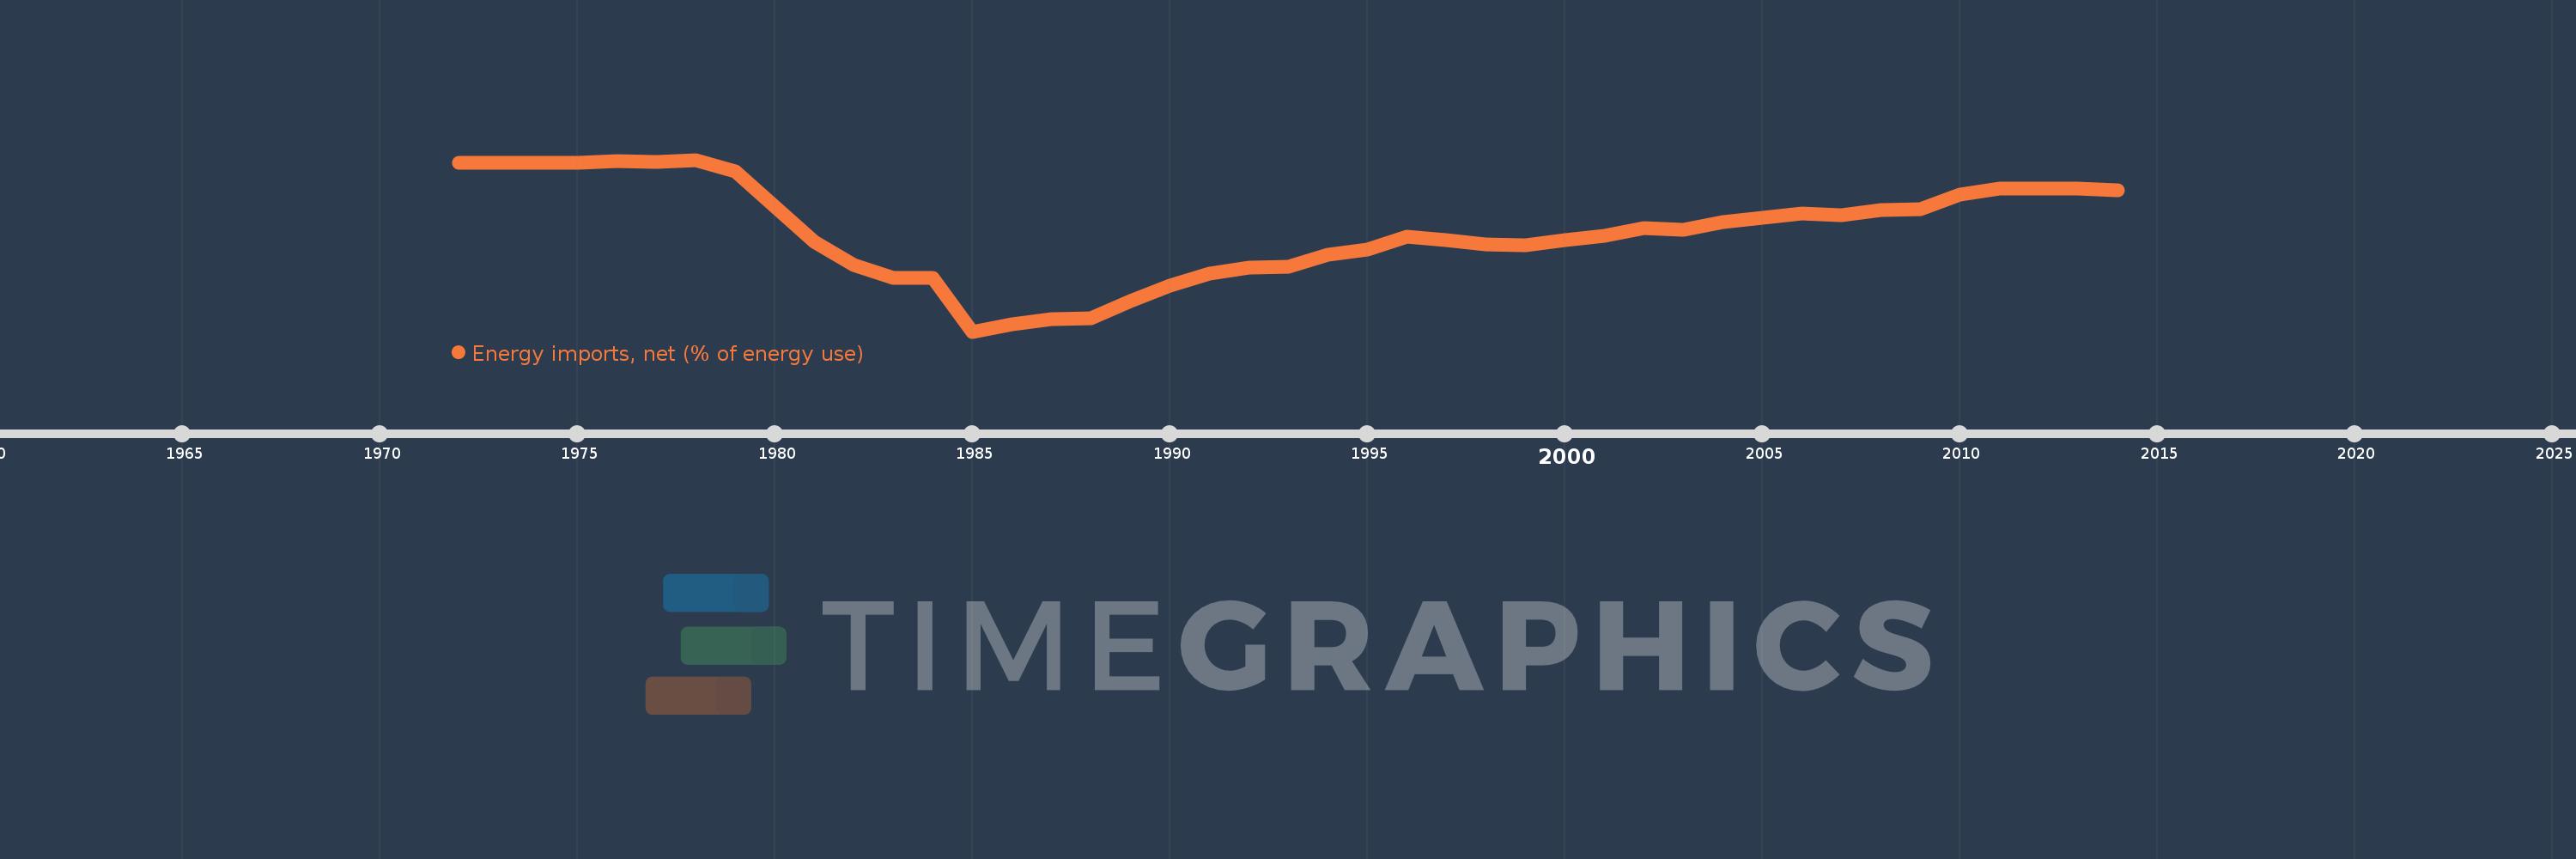
Energy imports, net (% of energy use)
2014,2013,2012,2011,2010,2009,2008,2007,2006,2005,2004,2003,2002,2001,2000,1999,1998,1997,1996,1995,1994,1993,1992,1991,1990,1989,1988,1987,1986,1985,1984,1983,1982,1981,1980,1979,1978,1977,1976,1975,1974,1973,1972
Estas estatísticas em outros países:
AlbaniaAlgeriaAngolaArab WorldArgentinaArmeniaAustraliaAustriaAzerbaijanBahrainBangladeshBelarusBelgiumBeninBoliviaBosnia and HerzegovinaBotswanaBrazilBrunei DarussalamBulgariaCambodiaCameroonCanadaCaribbean small statesCentral Europe and the BalticsChileChinaColombiaCongo, Dem. Rep.Congo, Rep.Costa RicaCote d'IvoireCroatiaCubaCuracaoCyprusCzech RepublicDenmarkDominican RepublicEarly-demographic dividendEast Asia & PacificEast Asia & Pacific (excluding high income)East Asia & Pacific (IDA & IBRD countries)EcuadorEgypt, Arab Rep.El SalvadorEritreaEstoniaEthiopiaEuro areaEurope & Central AsiaEurope & Central Asia (excluding high income)Europe & Central Asia (IDA & IBRD countries)European UnionFinlandFragile and conflict affected situationsFranceGabonGeorgiaGermanyGhanaGibraltarGreeceGuatemalaHaitiHeavily indebted poor countries (HIPC)High incomeHondurasHong Kong SAR, ChinaHungaryIBRD onlyIcelandIDA & IBRD totalIDA blendIDA onlyIDA totalIndiaIndonesiaIran, Islamic Rep.IraqIrelandIsraelItalyJamaicaJapanJordanKazakhstanKenyaKorea, Dem. People’s Rep.Korea, Rep.KosovoKuwaitKyrgyz RepublicLate-demographic dividendLatin America & Caribbean Latin America & Caribbean (excluding high income)Latin America & the Caribbean (IDA & IBRD countries)LatviaLeast developed countries: UN classificationLebanonLibyaLithuaniaLow & middle incomeLow incomeLower middle incomeLuxembourgMacedonia, FYRMalaysiaMaltaMauritiusMexicoMiddle East & North AfricaMiddle East & North Africa (excluding high income)Middle East & North Africa (IDA & IBRD countries)Middle incomeMoldovaMongoliaMontenegroMoroccoMozambiqueMyanmarNamibiaNepalNetherlandsNew ZealandNicaraguaNigerNigeriaNorth AmericaNorwayOECD membersOmanOther small statesPakistanPanamaParaguayPeruPhilippinesPolandPortugalPost-demographic dividendPre-demographic dividendQatarRomaniaRussian FederationSaudi ArabiaSenegalSerbiaSingaporeSlovak RepublicSloveniaSmall statesSouth AfricaSouth AsiaSouth Asia (IDA & IBRD)South SudanSpainSri LankaSub-Saharan Africa Sub-Saharan Africa (excluding high income)Sub-Saharan Africa (IDA & IBRD countries)SudanSwedenSwitzerlandSyrian Arab RepublicTajikistanTanzaniaThailandTogoTrinidad and TobagoTunisiaTurkeyTurkmenistanUkraineUnited Arab EmiratesUnited KingdomUnited StatesUpper middle incomeUruguayUzbekistanVenezuela, RBVietnamWorldYemen, Rep.ZambiaZimbabwe Linha do tempo:
Nesta escala de tempo está apresentado um gráfico de 1972 ano até 2014 ano Cameroon. Dados de 1971 ano ausente. O número de observações reais por data: 43.
Fonte (nome):
Indicadores de desenvolvimento mundial
Fonte (organização):
IEA Statistics © OECD/IEA 2014 (http://www.iea.org/stats/index.asp), subject to https://www.iea.org/t&c/termsandconditions/
Categorias:
Energy & Mining, Trade
Foi atualizado:
23 abr 2017 ano
Indicadores de alterações dos valores ao longo dos anos
Mínimo:
-188.831
1 jan 1985 ano
Máximo:
12.899
1 jan 1978 ano
Na data de observação
Valor
Mudança absoluta
A alteração em relação ao valor anterior
1 jan 1972 ano
9.007
+9.007
0.0%
1 jan 1973 ano
9.219
+0.212
2.35%
1 jan 1974 ano
9.373
+0.153
1.66%
1 jan 1975 ano
9.472
+0.1
1.06%
1 jan 1976 ano
11.391
+1.919
20.26%
1 jan 1977 ano
10.471
-0.92
-8.07%
1 jan 1978 ano
12.899
+2.428
23.19%
1 jan 1979 ano
-0.681
-13.58
-105.28%
1 jan 1980 ano
-42.467
-41.786
6.13 mil%
1 jan 1981 ano
-83.484
-41.017
96.59%
1 jan 1982 ano
-110.256
-26.772
32.07%
1 jan 1983 ano
-125.396
-15.14
13.73%
1 jan 1984 ano
-125.483
-0.087
0.07%
1 jan 1985 ano
-188.831
-63.348
50.48%
1 jan 1986 ano
-180.046
+8.786
-4.65%
1 jan 1987 ano
-174.638
+5.408
-3.0%
1 jan 1988 ano
-172.965
+1.673
-0.96%
1 jan 1989 ano
-152.806
+20.158
-11.65%
1 jan 1990 ano
-134.932
+17.875
-11.7%
1 jan 1991 ano
-120.354
+14.577
-10.8%
1 jan 1992 ano
-113.303
+7.051
-5.86%
1 jan 1993 ano
-113.176
+0.128
-0.11%
1 jan 1994 ano
-98.666
+14.51
-12.82%
1 jan 1995 ano
-92.722
+5.943
-6.02%
1 jan 1996 ano
-77.644
+15.079
-16.26%
1 jan 1997 ano
-81.72
-4.076
5.25%
1 jan 1998 ano
-86.933
-5.213
6.38%
1 jan 1999 ano
-87.402
-0.469
0.54%
1 jan 2000 ano
-81.659
+5.743
-6.57%
1 jan 2001 ano
-76.629
+5.031
-6.16%
1 jan 2002 ano
-67.53
+9.099
-11.87%
1 jan 2003 ano
-68.928
-1.398
2.07%
1 jan 2004 ano
-60.622
+8.306
-12.05%
1 jan 2005 ano
-54.711
+5.912
-9.75%
1 jan 2006 ano
-49.771
+4.94
-9.03%
1 jan 2007 ano
-52.608
-2.837
5.7%
1 jan 2008 ano
-45.839
+6.769
-12.87%
1 jan 2009 ano
-45.455
+0.384
-0.84%
1 jan 2010 ano
-27.925
+17.53
-38.56%
1 jan 2011 ano
-20.648
+7.278
-26.06%
1 jan 2012 ano
-21.291
-0.643
3.12%
1 jan 2013 ano
-21.073
+0.218
-1.02%
1 jan 2014 ano
-22.412
-1.339
6.35%
Classificação de países por estatísticas atuais por anos


Comentários: