29
/pt/
pt
AIzaSyAYiBZKx7MnpbEhh9jyipgxe19OcubqV5w
April 1, 2024
267890
Tunisia
TUN
true
2
1
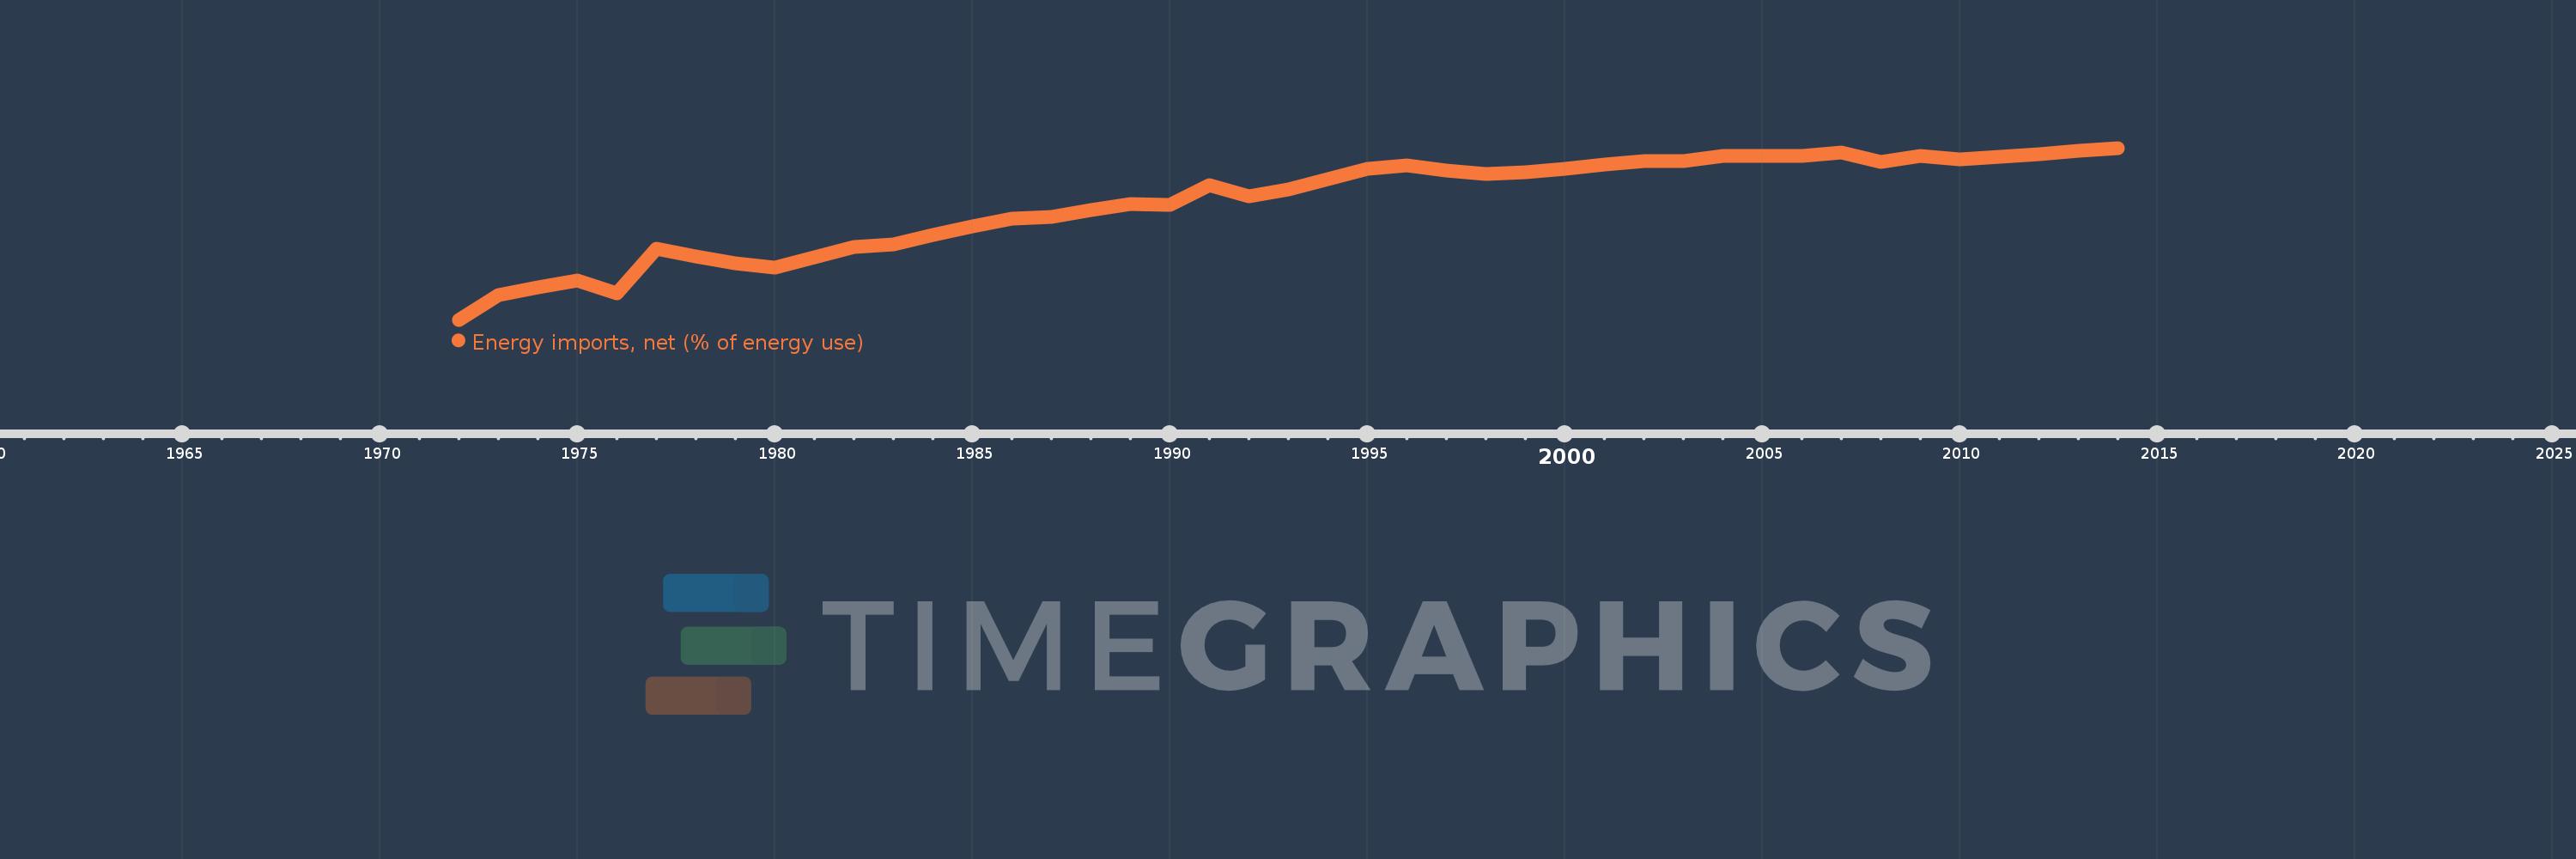
Energy imports, net (% of energy use)
2014,2013,2012,2011,2010,2009,2008,2007,2006,2005,2004,2003,2002,2001,2000,1999,1998,1997,1996,1995,1994,1993,1992,1991,1990,1989,1988,1987,1986,1985,1984,1983,1982,1981,1980,1979,1978,1977,1976,1975,1974,1973,1972
Estas estatísticas em outros países:
AlbaniaAlgeriaAngolaArab WorldArgentinaArmeniaAustraliaAustriaAzerbaijanBahrainBangladeshBelarusBelgiumBeninBoliviaBosnia and HerzegovinaBotswanaBrazilBrunei DarussalamBulgariaCambodiaCameroonCanadaCaribbean small statesCentral Europe and the BalticsChileChinaColombiaCongo, Dem. Rep.Congo, Rep.Costa RicaCote d'IvoireCroatiaCubaCuracaoCyprusCzech RepublicDenmarkDominican RepublicEarly-demographic dividendEast Asia & PacificEast Asia & Pacific (excluding high income)East Asia & Pacific (IDA & IBRD countries)EcuadorEgypt, Arab Rep.El SalvadorEritreaEstoniaEthiopiaEuro areaEurope & Central AsiaEurope & Central Asia (excluding high income)Europe & Central Asia (IDA & IBRD countries)European UnionFinlandFragile and conflict affected situationsFranceGabonGeorgiaGermanyGhanaGibraltarGreeceGuatemalaHaitiHeavily indebted poor countries (HIPC)High incomeHondurasHong Kong SAR, ChinaHungaryIBRD onlyIcelandIDA & IBRD totalIDA blendIDA onlyIDA totalIndiaIndonesiaIran, Islamic Rep.IraqIrelandIsraelItalyJamaicaJapanJordanKazakhstanKenyaKorea, Dem. People’s Rep.Korea, Rep.KosovoKuwaitKyrgyz RepublicLate-demographic dividendLatin America & Caribbean Latin America & Caribbean (excluding high income)Latin America & the Caribbean (IDA & IBRD countries)LatviaLeast developed countries: UN classificationLebanonLibyaLithuaniaLow & middle incomeLow incomeLower middle incomeLuxembourgMacedonia, FYRMalaysiaMaltaMauritiusMexicoMiddle East & North AfricaMiddle East & North Africa (excluding high income)Middle East & North Africa (IDA & IBRD countries)Middle incomeMoldovaMongoliaMontenegroMoroccoMozambiqueMyanmarNamibiaNepalNetherlandsNew ZealandNicaraguaNigerNigeriaNorth AmericaNorwayOECD membersOmanOther small statesPakistanPanamaParaguayPeruPhilippinesPolandPortugalPost-demographic dividendPre-demographic dividendQatarRomaniaRussian FederationSaudi ArabiaSenegalSerbiaSingaporeSlovak RepublicSloveniaSmall statesSouth AfricaSouth AsiaSouth Asia (IDA & IBRD)South SudanSpainSri LankaSub-Saharan Africa Sub-Saharan Africa (excluding high income)Sub-Saharan Africa (IDA & IBRD countries)SudanSwedenSwitzerlandSyrian Arab RepublicTajikistanTanzaniaThailandTogoTrinidad and TobagoTunisiaTurkeyTurkmenistanUkraineUnited Arab EmiratesUnited KingdomUnited StatesUpper middle incomeUruguayUzbekistanVenezuela, RBVietnamWorldYemen, Rep.ZambiaZimbabwe Linha do tempo:
Nesta escala de tempo está apresentado um gráfico de 1972 ano até 2014 ano Tunisia. Dados de 1971 ano ausente. O número de observações reais por data: 43.
Fonte (nome):
Indicadores de desenvolvimento mundial
Fonte (organização):
IEA Statistics © OECD/IEA 2014 (http://www.iea.org/stats/index.asp), subject to https://www.iea.org/t&c/termsandconditions/
Categorias:
Energy & Mining, Trade
Foi atualizado:
23 abr 2017 ano
Indicadores de alterações dos valores ao longo dos anos
Mínimo:
-181.015
1 jan 1972 ano
Máximo:
29.922
1 jan 2014 ano
Na data de observação
Valor
Mudança absoluta
A alteração em relação ao valor anterior
1 jan 1972 ano
-181.015
-181.015
0.0%
1 jan 1973 ano
-151.008
+30.007
-16.58%
1 jan 1974 ano
-140.752
+10.256
-6.79%
1 jan 1975 ano
-133.156
+7.595
-5.4%
1 jan 1976 ano
-148.542
-15.386
11.55%
1 jan 1977 ano
-93.729
+54.813
-36.9%
1 jan 1978 ano
-103.758
-10.029
10.7%
1 jan 1979 ano
-111.867
-8.11
7.82%
1 jan 1980 ano
-117.305
-5.437
4.86%
1 jan 1981 ano
-104.179
+13.125
-11.19%
1 jan 1982 ano
-92.098
+12.081
-11.6%
1 jan 1983 ano
-88.393
+3.705
-4.02%
1 jan 1984 ano
-76.934
+11.458
-12.96%
1 jan 1985 ano
-65.987
+10.947
-14.23%
1 jan 1986 ano
-57.398
+8.59
-13.02%
1 jan 1987 ano
-55.262
+2.136
-3.72%
1 jan 1988 ano
-46.831
+8.431
-15.26%
1 jan 1989 ano
-38.424
+8.407
-17.95%
1 jan 1990 ano
-40.077
-1.653
4.3%
1 jan 1991 ano
-15.784
+24.293
-60.62%
1 jan 1992 ano
-29.853
-14.069
89.14%
1 jan 1993 ano
-21.214
+8.639
-28.94%
1 jan 1994 ano
-8.09
+13.124
-61.86%
1 jan 1995 ano
4.59
+12.68
-156.73%
1 jan 1996 ano
8.176
+3.587
78.15%
1 jan 1997 ano
2.622
-5.554
-67.93%
1 jan 1998 ano
-1.543
-4.165
-158.83%
1 jan 1999 ano
0.58
+2.123
-137.6%
1 jan 2000 ano
4.513
+3.933
678.08%
1 jan 2001 ano
9.197
+4.684
103.78%
1 jan 2002 ano
13.946
+4.749
51.64%
1 jan 2003 ano
14.182
+0.236
1.69%
1 jan 2004 ano
19.626
+5.444
38.39%
1 jan 2005 ano
19.59
-0.035
-0.18%
1 jan 2006 ano
19.641
+0.05
0.26%
1 jan 2007 ano
24.224
+4.583
23.33%
1 jan 2008 ano
12.583
-11.641
-48.06%
1 jan 2009 ano
19.89
+7.307
58.07%
1 jan 2010 ano
16.021
-3.868
-19.45%
1 jan 2011 ano
18.971
+2.95
18.41%
1 jan 2012 ano
22.195
+3.225
17.0%
1 jan 2013 ano
26.162
+3.967
17.87%
1 jan 2014 ano
29.922
+3.76
14.37%
Classificação de países por estatísticas atuais por anos


Comentários: