29
/pt/
pt
AIzaSyAYiBZKx7MnpbEhh9jyipgxe19OcubqV5w
April 1, 2024
207865
Netherlands
NLD
true
2
1
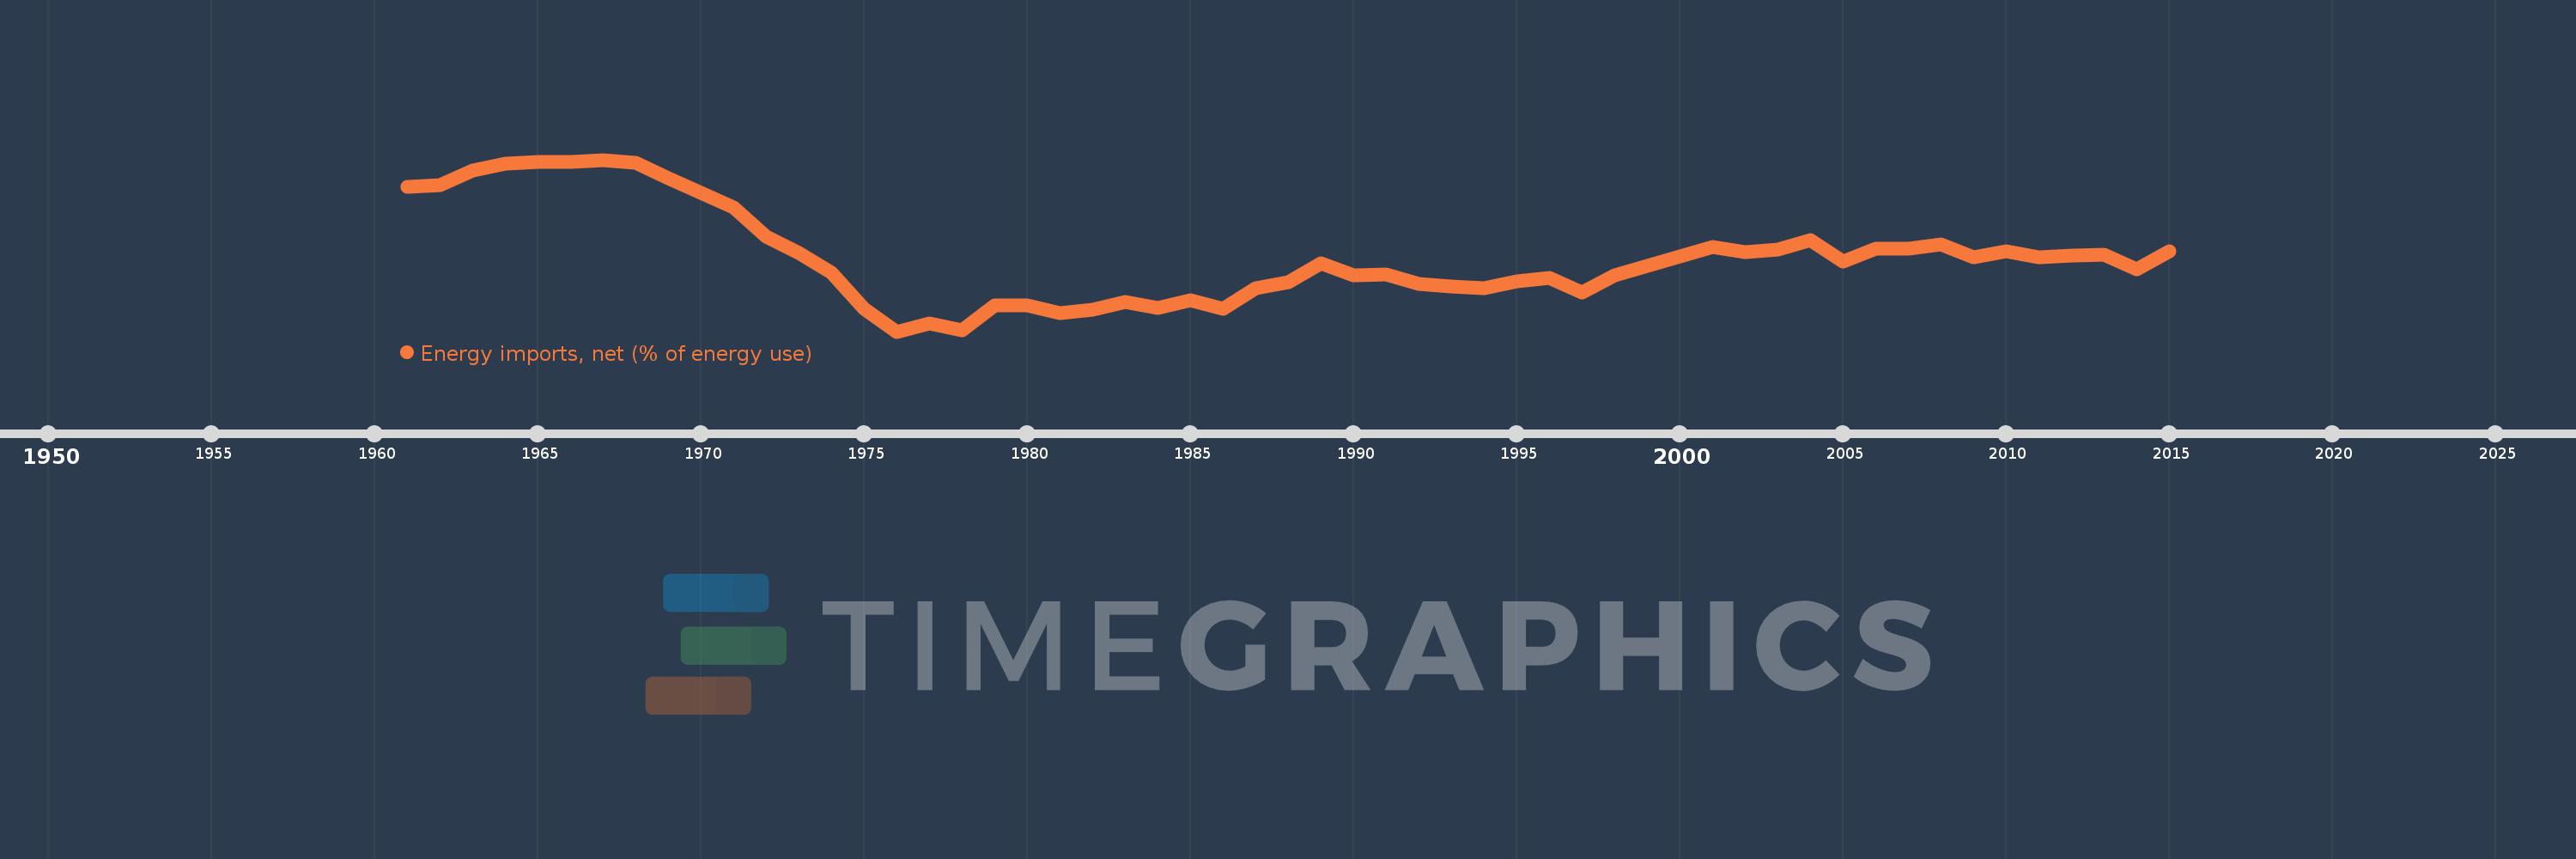
Energy imports, net (% of energy use)
2015,2014,2013,2012,2011,2010,2009,2008,2007,2006,2005,2004,2003,2002,2001,2000,1999,1998,1997,1996,1995,1994,1993,1992,1991,1990,1989,1988,1987,1986,1985,1984,1983,1982,1981,1980,1979,1978,1977,1976,1975,1974,1973,1972,1971,1970,1969,1968,1967,1966,1965,1964,1963,1962,1961
Estas estatísticas em outros países:
AlbaniaAlgeriaAngolaArab WorldArgentinaArmeniaAustraliaAustriaAzerbaijanBahrainBangladeshBelarusBelgiumBeninBoliviaBosnia and HerzegovinaBotswanaBrazilBrunei DarussalamBulgariaCambodiaCameroonCanadaCaribbean small statesCentral Europe and the BalticsChileChinaColombiaCongo, Dem. Rep.Congo, Rep.Costa RicaCote d'IvoireCroatiaCubaCuracaoCyprusCzech RepublicDenmarkDominican RepublicEarly-demographic dividendEast Asia & PacificEast Asia & Pacific (excluding high income)East Asia & Pacific (IDA & IBRD countries)EcuadorEgypt, Arab Rep.El SalvadorEritreaEstoniaEthiopiaEuro areaEurope & Central AsiaEurope & Central Asia (excluding high income)Europe & Central Asia (IDA & IBRD countries)European UnionFinlandFragile and conflict affected situationsFranceGabonGeorgiaGermanyGhanaGibraltarGreeceGuatemalaHaitiHeavily indebted poor countries (HIPC)High incomeHondurasHong Kong SAR, ChinaHungaryIBRD onlyIcelandIDA & IBRD totalIDA blendIDA onlyIDA totalIndiaIndonesiaIran, Islamic Rep.IraqIrelandIsraelItalyJamaicaJapanJordanKazakhstanKenyaKorea, Dem. People’s Rep.Korea, Rep.KosovoKuwaitKyrgyz RepublicLate-demographic dividendLatin America & Caribbean Latin America & Caribbean (excluding high income)Latin America & the Caribbean (IDA & IBRD countries)LatviaLeast developed countries: UN classificationLebanonLibyaLithuaniaLow & middle incomeLow incomeLower middle incomeLuxembourgMacedonia, FYRMalaysiaMaltaMauritiusMexicoMiddle East & North AfricaMiddle East & North Africa (excluding high income)Middle East & North Africa (IDA & IBRD countries)Middle incomeMoldovaMongoliaMontenegroMoroccoMozambiqueMyanmarNamibiaNepalNetherlandsNew ZealandNicaraguaNigerNigeriaNorth AmericaNorwayOECD membersOmanOther small statesPakistanPanamaParaguayPeruPhilippinesPolandPortugalPost-demographic dividendPre-demographic dividendQatarRomaniaRussian FederationSaudi ArabiaSenegalSerbiaSingaporeSlovak RepublicSloveniaSmall statesSouth AfricaSouth AsiaSouth Asia (IDA & IBRD)South SudanSpainSri LankaSub-Saharan Africa Sub-Saharan Africa (excluding high income)Sub-Saharan Africa (IDA & IBRD countries)SudanSwedenSwitzerlandSyrian Arab RepublicTajikistanTanzaniaThailandTogoTrinidad and TobagoTunisiaTurkeyTurkmenistanUkraineUnited Arab EmiratesUnited KingdomUnited StatesUpper middle incomeUruguayUzbekistanVenezuela, RBVietnamWorldYemen, Rep.ZambiaZimbabwe Linha do tempo:
Nesta escala de tempo está apresentado um gráfico de 1961 ano até 2015 ano Netherlands. Dados de 1960 ano ausente. O número de observações reais por data: 55.
Fonte (nome):
Indicadores de desenvolvimento mundial
Fonte (organização):
IEA Statistics © OECD/IEA 2014 (http://www.iea.org/stats/index.asp), subject to https://www.iea.org/t&c/termsandconditions/
Categorias:
Energy & Mining, Trade
Foi atualizado:
23 abr 2017 ano
Indicadores de alterações dos valores ao longo dos anos
Mínimo:
-20.86
1 jan 1976 ano
Máximo:
64.779
1 jan 1967 ano
Na data de observação
Valor
Mudança absoluta
A alteração em relação ao valor anterior
1 jan 1961 ano
51.368
+51.368
0.0%
1 jan 1962 ano
52.005
+0.636
1.24%
1 jan 1963 ano
59.391
+7.386
14.2%
1 jan 1964 ano
62.879
+3.488
5.87%
1 jan 1965 ano
63.628
+0.749
1.19%
1 jan 1966 ano
63.835
+0.207
0.33%
1 jan 1967 ano
64.779
+0.944
1.48%
1 jan 1968 ano
63.204
-1.575
-2.43%
1 jan 1969 ano
55.596
-7.609
-12.04%
1 jan 1970 ano
48.302
-7.293
-13.12%
1 jan 1971 ano
41.2
-7.102
-14.7%
1 jan 1972 ano
26.59
-14.61
-35.46%
1 jan 1973 ano
18.174
-8.416
-31.65%
1 jan 1974 ano
8.447
-9.726
-53.52%
1 jan 1975 ano
-9.411
-17.859
-211.41%
1 jan 1976 ano
-20.86
-11.448
121.65%
1 jan 1977 ano
-16.816
+4.044
-19.39%
1 jan 1978 ano
-20.337
-3.521
20.94%
1 jan 1979 ano
-7.601
+12.735
-62.62%
1 jan 1980 ano
-7.603
-0.002
0.02%
1 jan 1981 ano
-11.585
-3.982
52.37%
1 jan 1982 ano
-9.745
+1.839
-15.88%
1 jan 1983 ano
-6.055
+3.691
-37.87%
1 jan 1984 ano
-9.282
-3.227
53.3%
1 jan 1985 ano
-5.199
+4.083
-43.99%
1 jan 1986 ano
-9.392
-4.193
80.65%
1 jan 1987 ano
0.948
+10.34
-110.09%
1 jan 1988 ano
3.732
+2.784
293.76%
1 jan 1989 ano
13.346
+9.615
257.66%
1 jan 1990 ano
7.285
-6.061
-45.41%
1 jan 1991 ano
7.827
+0.542
7.44%
1 jan 1992 ano
2.861
-4.966
-63.45%
1 jan 1993 ano
1.409
-1.452
-50.74%
1 jan 1994 ano
0.573
-0.836
-59.34%
1 jan 1995 ano
4.26
+3.687
643.41%
1 jan 1996 ano
5.732
+1.472
34.56%
1 jan 1997 ano
-1.521
-7.253
-126.53%
1 jan 1998 ano
7.377
+8.898
-585.04%
1 jan 1999 ano
11.904
+4.526
61.36%
1 jan 2000 ano
16.71
+4.806
40.37%
1 jan 2001 ano
21.379
+4.67
27.95%
1 jan 2002 ano
18.719
-2.66
-12.44%
1 jan 2003 ano
19.884
+1.165
6.22%
1 jan 2004 ano
24.722
+4.838
24.33%
1 jan 2005 ano
13.963
-10.759
-43.52%
1 jan 2006 ano
20.61
+6.647
47.6%
1 jan 2007 ano
20.477
-0.133
-0.65%
1 jan 2008 ano
22.793
+2.317
11.31%
1 jan 2009 ano
16.271
-6.523
-28.62%
1 jan 2010 ano
19.337
+3.066
18.84%
1 jan 2011 ano
16.315
-3.022
-15.63%
1 jan 2012 ano
16.88
+0.565
3.46%
1 jan 2013 ano
17.609
+0.729
4.32%
1 jan 2014 ano
10.33
-7.278
-41.33%
1 jan 2015 ano
19.367
+9.037
87.48%
Classificação de países por estatísticas atuais por anos


Comentários: